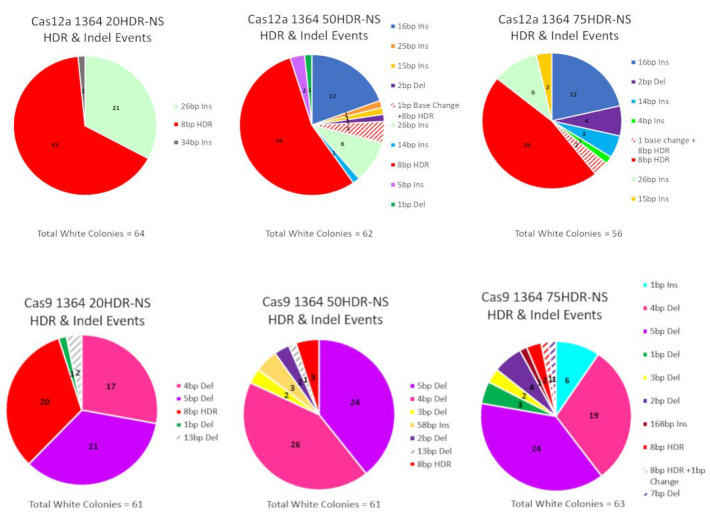
Figure 5.
Frequency of HDR and Indel events in CRISPR/Cas12a and CRISPR/Cas9 reactions. Each pie chart represents a reaction condition utilizing CRISPR/Cas12a or CRISPR/Cas9 in combination with the 20, 50, or 75 base homology arm ODN and the triplicate experiments done within each nuclease. The total number of events (HDR or Indels) and the frequency of those events are illustrated by different colors. A precise integration of the eight base NOTI site is depicted in red and the remaining colors depict various types of Indels.

