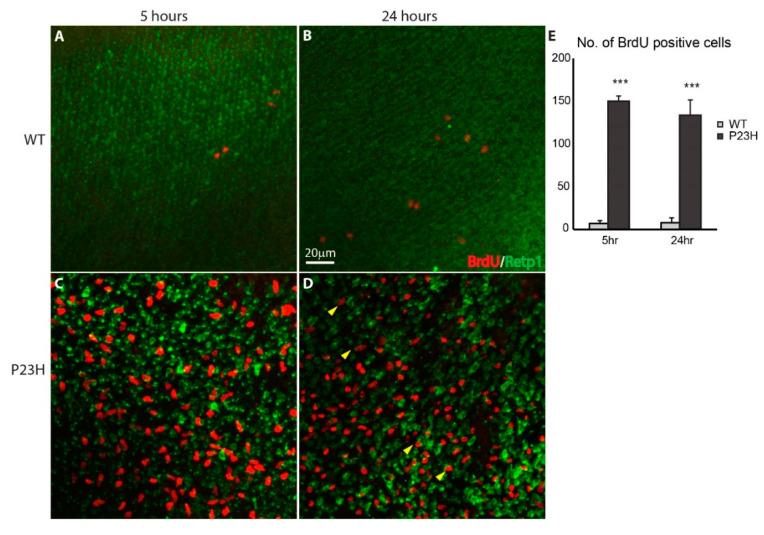
Figure 6.
Continuous cell proliferation in the P23H transgenic zebrafish. Wholemount imaging of BrdU (red) labeled cells in ONL of the WT (A,B) and P23H transgenic (C,D) 5 and 24 h after BrdU injection respectively. Retp1 (green) labels rhodopsin. Yellow arrowheads in panel D show BrdU-labeled cells that co-label with Retp1, indicating their differentiation into rods. Scale bar in B applies to A–D. (E) The number of BrdU-labeled cells in the P23H transgenic fish is significantly higher than in the WT (n = 3 fish per genotype; error bars are ± SD; *** p < 0.001).

