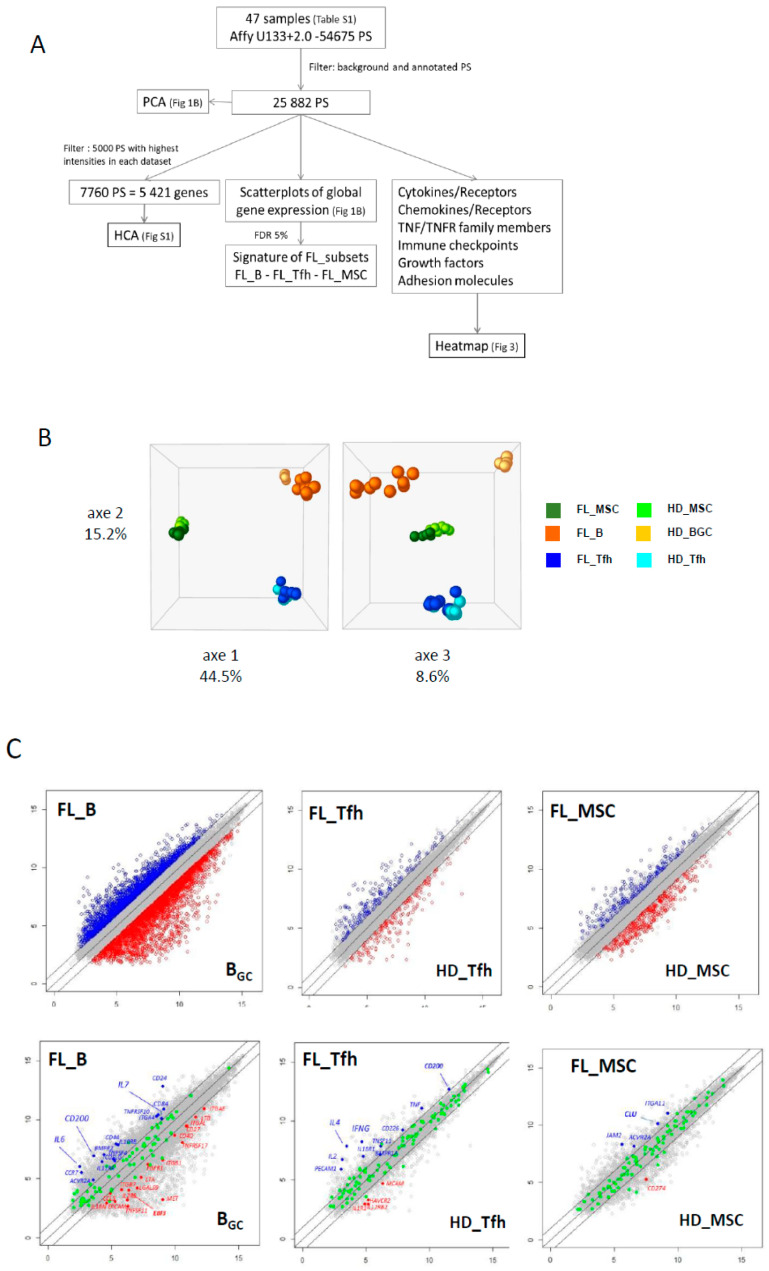
Figure 1.
(A) Microarray data analysis strategy. (B) Principal component analysis (PCA) shows tight clustering of the mesenchymal stromal cell (MSC) compartment, B (B) and T follicular helper (Tfh) lymphocytes from normal and tumoral contexts. The first three axes total 68.3% of the total inertia of the dataset. (C) Scatterplots of pairwise global gene expression comparison between FL (follicular lymphoma) and non-tumoral samples, in B lymphocytes (left panel), Tfh (middle panel) or stromal cells (right panel). Gene expression values are plotted on a log scale. Genes that were differentially expressed (FDR (false discovery rate) ≤ 5%) with a fold change ≥2 (logFC ≥ 1) are indicated in red and blue. Top panel: representation of all annotated genes (21,319 PS (probesets) in B lymphocytes, 19,859 PS in Tfh and 20,142 PS in stromal cells). Bottom panel: highlight of genes (in green) differentially expressed (FDR ≤ 5%) with a fold change ≥2 (logFC ≥ 1).

