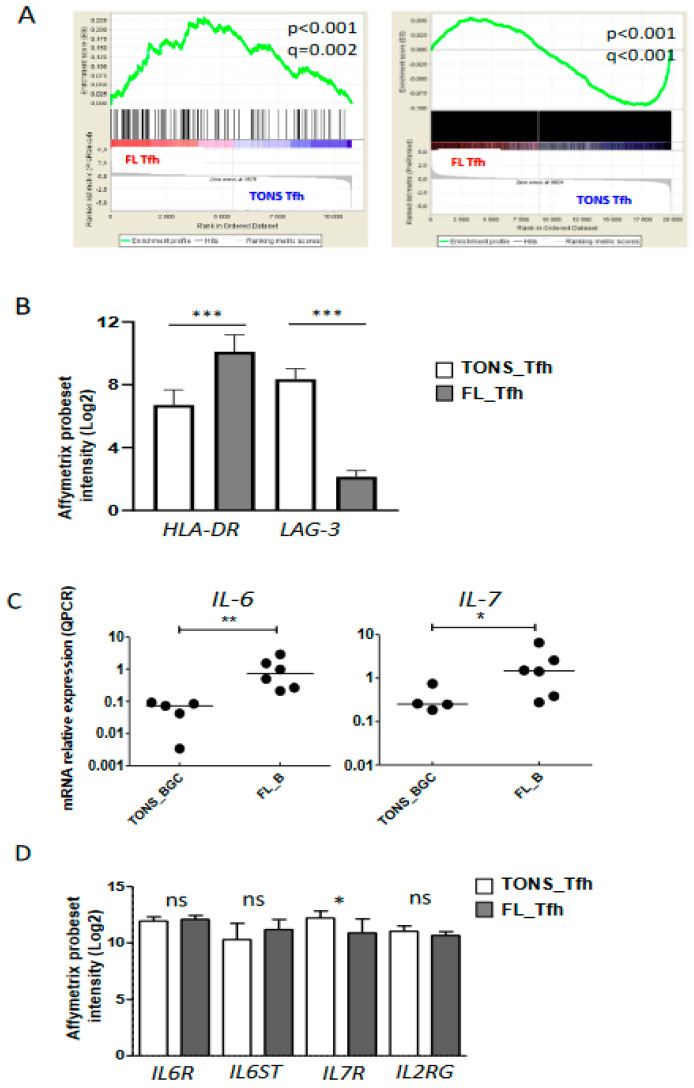
Figure 4.
Tfh activation in FL tumor. (A) Plots from GSEA (gene-set enrichment analysis) analyses comparing Tfh from FL (FL Tfh) or TONS (non-malignant tonsils; TONS Tfh) based on an activated T signature (M3319 MSigDB geneset in left panel and activated Tfh signature obtained by Tfh stimulation with anti-CD3/CD28 mAbs (see method) in right panel). Nominal p-value (p), and FDR (q) are given on the plot. FL Tfh are given on the left (red) of the plot and normal TONS_Tfh on the right (blue). (B) HLA-DR and LAG-3 mRNA expression on FL_Tfh or TONS_Tfh. (C) IL-6 (left panel) and IL-7 (right panel) mRNA expression by qRT-PCR in B lymphocytes isolated from reactive tonsils (TONS_BGC) (n = 5) or FL tumors (FL_B) (n = 6). The arbitrary value of 1 was assigned to a pool of five whole tonsil cells. (D) Gene expression of IL-6R and IL-7 subunits in normal Tfh (TONS_Tfh) or derived from FL (FL_Tfh). Bars: mean. ns non-significant, * p < 0.05, ** p < 0.01, *** p < 0.001.

