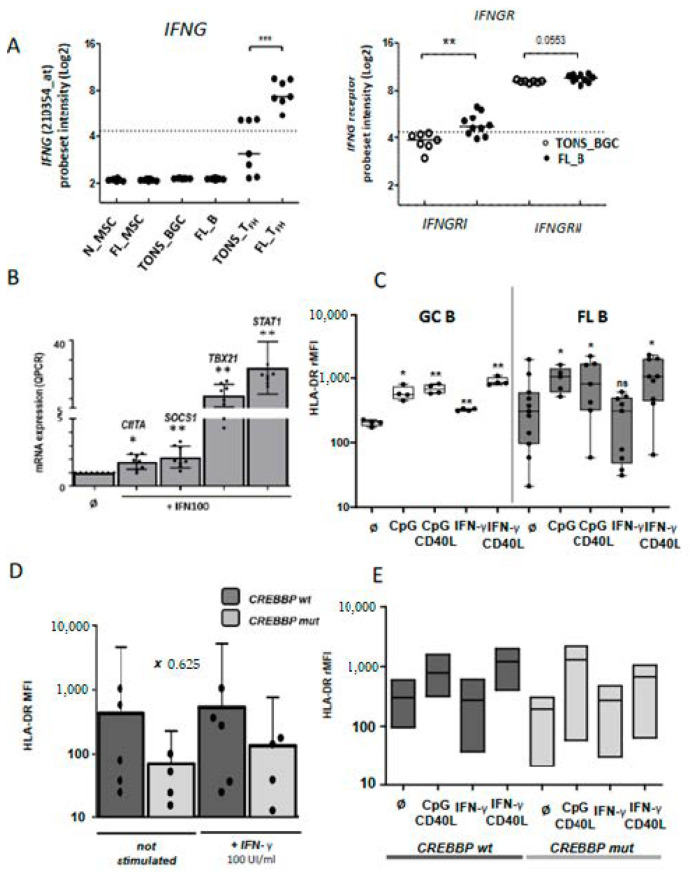
Figure 5.
IFN-γ pathway in malignant B cells: (A) Up-regulation of IFNG (left panel) and IFNGR (right panel) mRNA expression on normal and FL subpopulations. (B) mRNA expression by qRT-PCR of IFN-γ-target genes (CIITA, SOCS1, TBX21 and STAT1) in purified FL B cells stimulated or not (Ǿ) by IFN-γ 100 UI/mL (IFN100) for 24 h. (C) HLA-DR cell-surface expression on normal GC B cells (left panel) or FL B cells (right panel) cultivated for 24 h with CPG or IFN-γ, with or without CD40L stimulation, and according to CREBBP mutation. (D and E) rMFI: ratio of mean fluorescence intensity, wt: wild type, mut: mutation; Bars: mean. ns non-significant, * p < 0.05, ** p < 0.01, *** p < 0.001 compared to normal (A) or non-stimulated conditions (B to E).

