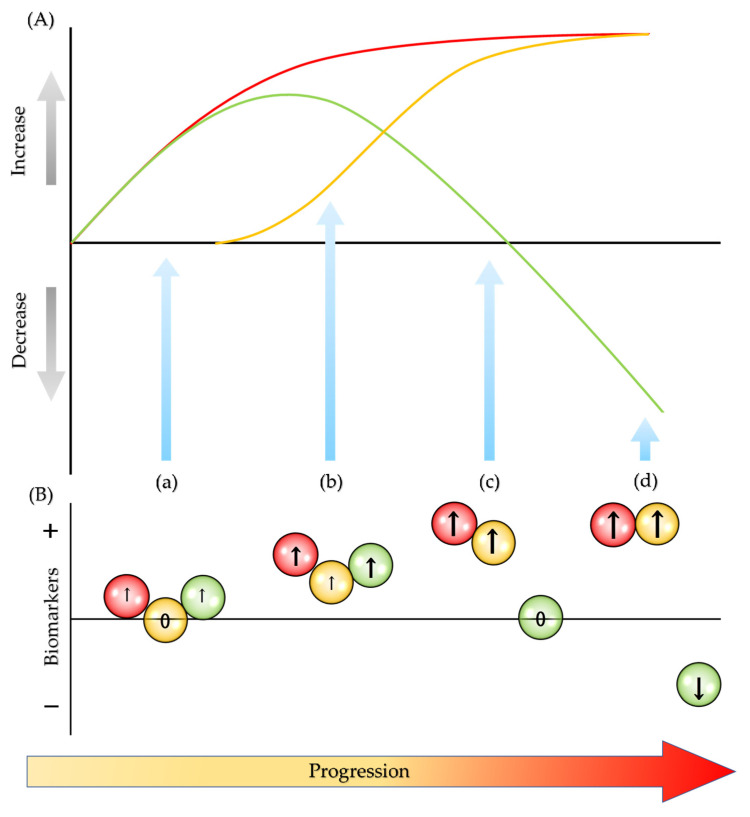
Figure 4.
Dynamics of redox components in disease progression. (A) – (red line): reactive chemical species and activities of oxidative enzymes increase gradually. – (orange line): the degradation products increase accordingly upon exhaustion of antioxidative enzymes’ activities. – (green line): antioxidative enzymes offset the effects of oxidative enzymes in the early phase, however; the antioxidative activities decline and, finally, fatigue in the later phase, resulting in the exacerbation of inflammation and cellular damage. (B) Biomarkers of three redox components may present different values. (a) The levels of oxidative enzyme slightly increase, but the degradation markers stay in a normal range. The antioxidative markers also slightly increase. (b) The oxidative markers further elevate, and the degradation markers start slightly increasing. The antioxidative markers also stay elevated. (c) The oxidative enzyme markers increase, but antioxidative markers return to normal range. The degradation product markers further elevate. (d) The oxidative markers greatly increase, but the antioxidative markers decline. The degradation products markers greatly elevate.  : oxidative biomarkers;
  : degradation biomarkers;
  : antioxidative biomarkers; ↑: increase; ↓: decrease; and 0: unchanged.

