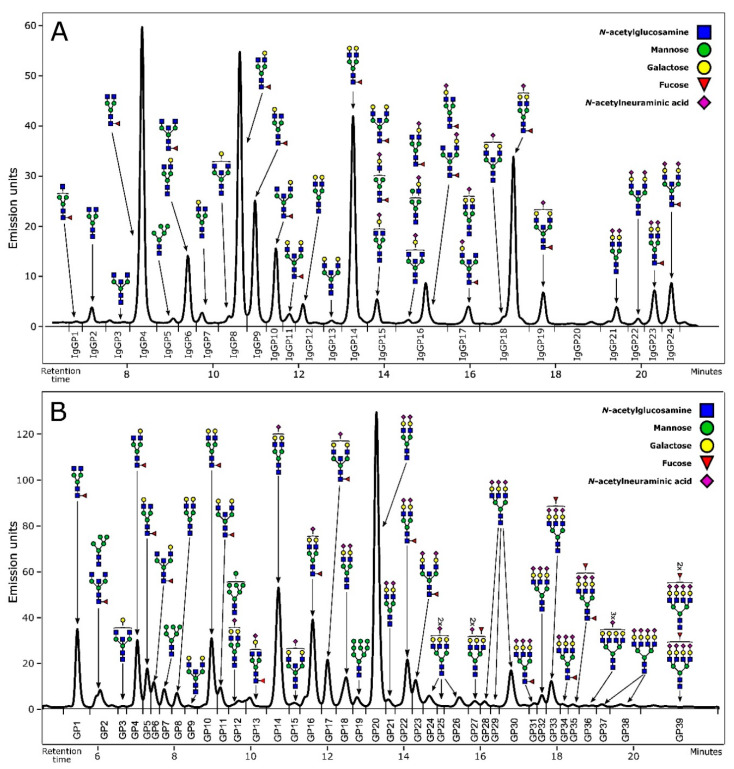
Figure 1.
Representative chromatograms of HILIC-UPLC-FLR profiled N-glycans. (a) IgG N-glycome profile with graphical representation of the glycan structures corresponding to every IgG glycan peak (IgGP). (b) Plasma protein N-glycome profile with graphical representation of the most abundant structures corresponding to every plasma glycan peak (GP).

