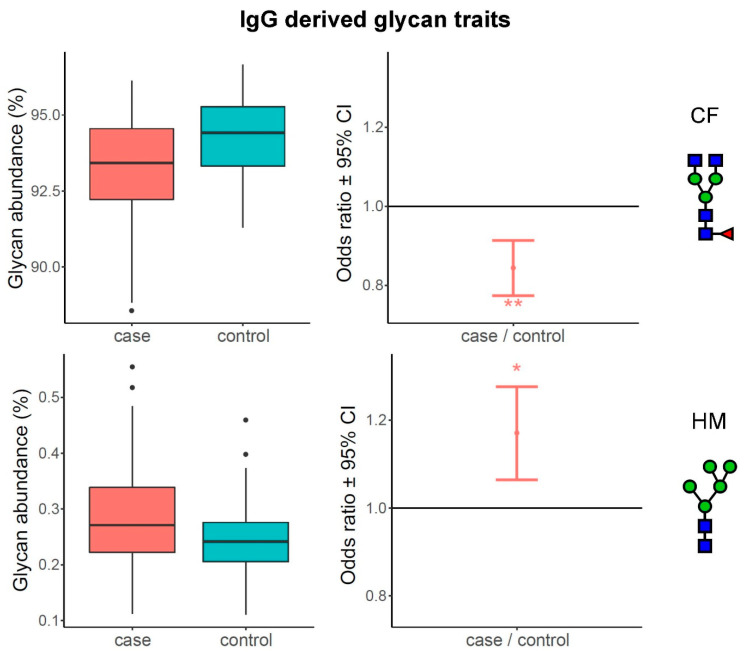
Figure 2.
Most prominent differences between MS subjects and matched controls in IgG derived glycan traits. The left part of the figure shows boxplots representing differences in glycan abundances, while the right part shows odds ratio plots, resulting from post-hoc tests. Boxes in the boxplot are ranging from 25th to 75th percentile, with the median represented as a line inside the box. The whiskers of the boxplot extend from both percentiles, 75th percentile for upper whisker and 25th for lower whisker, to the values within 1.5 × IQR. IQR is the inter-quartile range, also known as the distance from the first to the third quartile. Data outside the whiskers’ ends are outliers, represented with black dots, and are plotted individually. On the odds ratio plots, middle dot represents odds ratio value for represented derived glycan trait surrounded by its 95% confidence interval (CI). Odds ratio of 1.0 means that there is no difference between compared groups for the given trait. Asterisk symbols represent statistical significance: * < 0.05; ** < 0.01.

