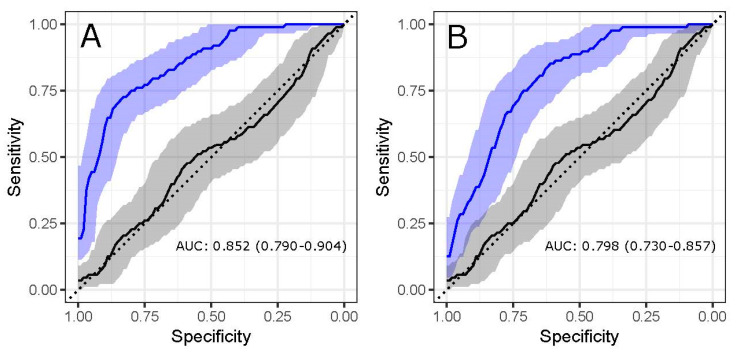
Figure 4.
Classification performance of plasma protein and IgG N-glycome. ROC curves represent the performance of logistic regression model in classification of multiple sclerosis status using the total plasma protein N-glycome (a) and total IgG N-glycome (b). The blue line represents classification of disease status using the N-glycan model, while the black line represents performance of age and sex in disease status classification. Graphs are showing area under the curve (AUC) values with 95% confidence intervals.

