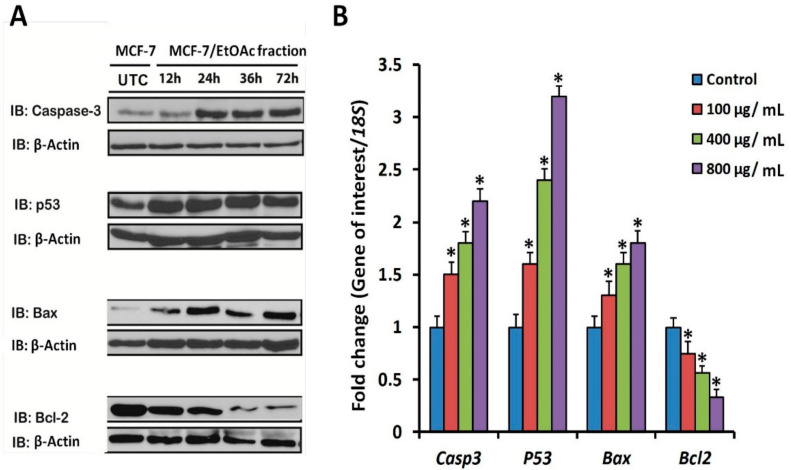
Figure 8.
Analysis of apoptosis gene transcript and protein marker levels in MCF-7 cells treated with EtOAc fraction (F3) of willow leaves. (A) Immunoblotting of pro-apoptotic (Casp3, p53 and Bax) and anti-apoptotic (Bcl-2) protein markers after treatment with EtoAc F3 in comparison to untreated control (DMSO 0.1%). For immunoblots, 40 µg protein extracts were used, treated prior to harvest with 100 µg F3/mL and incubated for 12, 24, 48 and 72 h. Specific antibodies were used to detect p53, Bax, Caspase-3 and Bcl-2. Anti-β actin was used as loading control. (B) Profiling of mRNA transcript levels of key pro- (Casp3, p53 and Bax) and anti-apoptotic (Bcl-2) genes in MCF-7 cells treated with three concentrations of EtOAc (F3) (100, 400 and 800 µg/mL). Gene expression levels were quantified after 72 h by RT-qPCR employing 18S as a housekeeping gene for normalization as detailed in the methods. Significant differences between the means of individual treatment and control were analyzed by a one-side Student’s t-test. Histograms represent mean expression level as fold change ± SEM for 3 technical and 2 biological replicas. Asterisk (*) denotes a significant difference at the probability level of p < 0.05 relative to solvent control (DMSO 0.1%).

