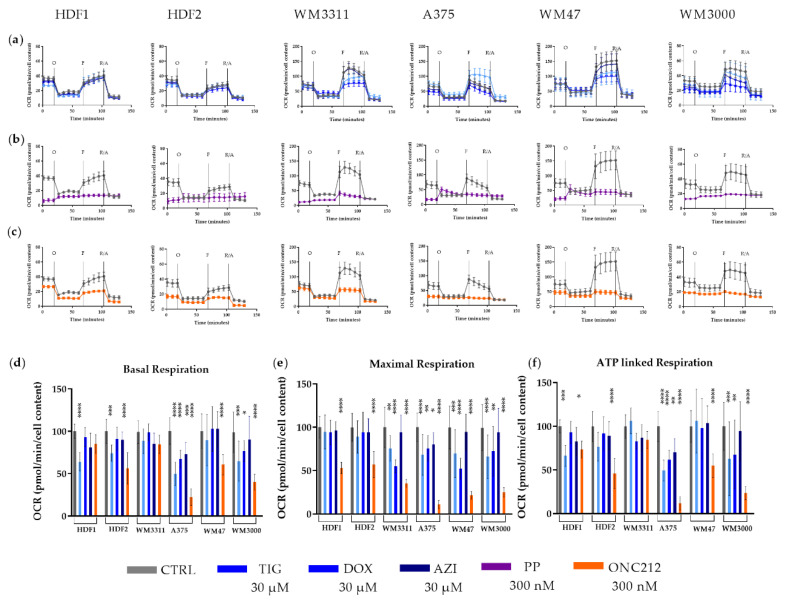
Figure 4.
OCR measurements of (a) TIX-, DOX- and AZI-treated, (b) PP-treated, (c) ONC212-treated melanoma cells and HDFs compared to corresponding vehicle-treated cells during a mitochondrial stress test. Levels of (d) basal respiration, (e) maximal respiration, and (f) ATP-linked respiration in TIX-, DOX-, AZI- and ONC212-treated cells expressed relative to values of vehicle-treated cells normalized to 100%. Values are given as mean ± SD. One-way ANOVA followed by Dunnett’s Multiple Comparison Test; * p ≤ 0.05; ** p ≤ 0.01; *** p ≤ 0.001; **** p ≤ 0.0001. For every cell line, two independent measurements with 6 to 8 replicates were performed. Cells were treated with 30 µM TIG, DOX and AZI, and 300 nM PP and ONC212. 5 µM Oligomycin (O); 2 µM FCCP (F); 0.5 µM Rotenone and Antimycin A (R/A).

