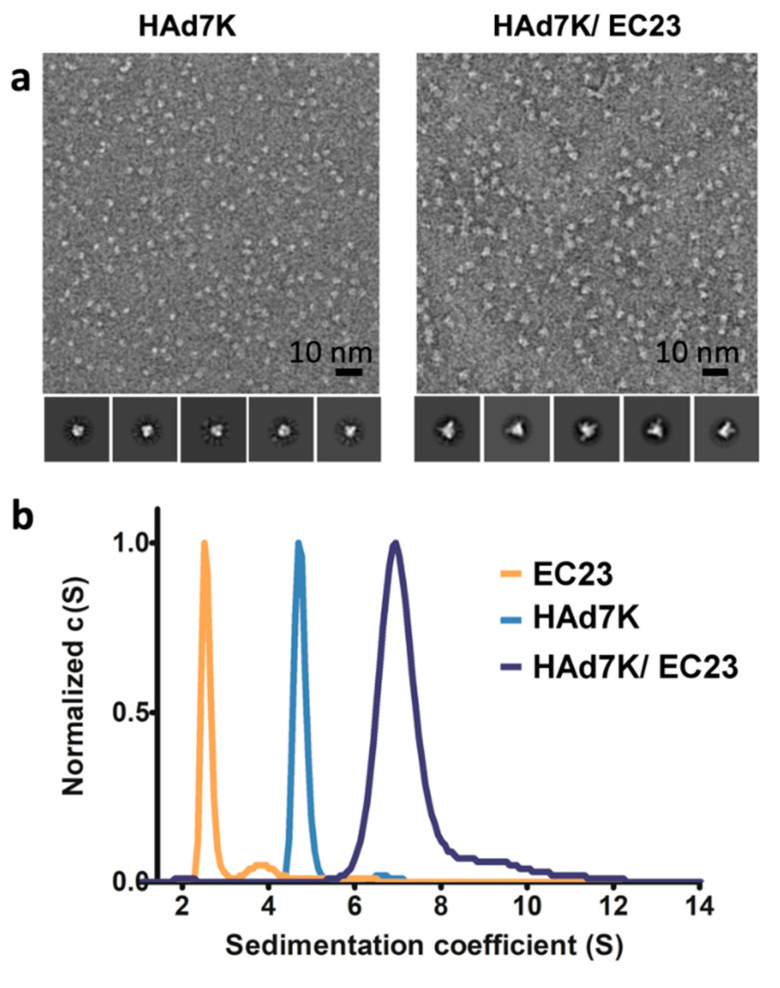
Figure 2.
(a) Negative-staining electron microscopy analysis. Left: electron micrograph of HAd7K. Right: electron micrograph of HAd7K in complex with EC23. Representative class averages are shown on the galleries below each micrograph. (b) Analytical ultracentrifugation (AUC) analysis. Normalized sedimentation coefficient distribution profiles obtained from sedimentation velocity experiments for HAd7K (in blue), EC23 (in orange) and for HAd7K in complex with EC23 (in grey).

