Figure 3.
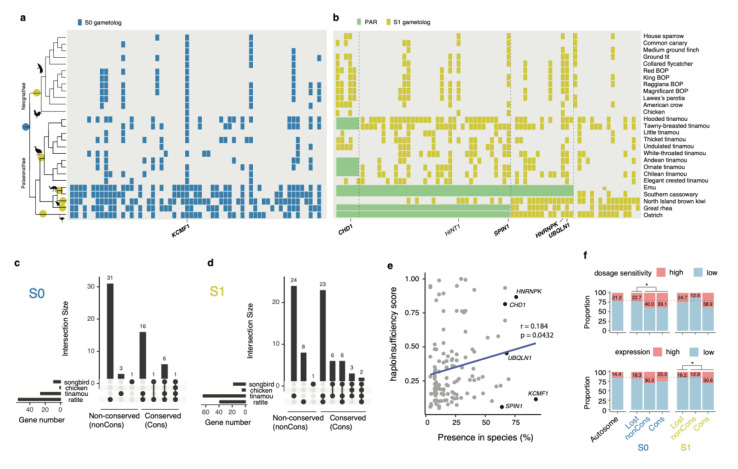
Conservation of W chromosome gene content maintained by purifying selection. (a,b) The colored circles on the phylogenetic branches indicate the origins of S0 (blue) and S1 (yellow). Each tile represents a W-linked gametolog. The genes are ordered according to their homologous positions on the emu Z chromosome. Five conserved boundary genes and HINT1 are highlighted. (c,d) The UpSet plots show the numbers of shared W-linked gametologs across three groups of songbirds, chicken, tinamous, and ratites. When one gene was shared by at least two groups of birds, it was defined as conserved. (e) The X-axis represents the percentage of species where the W-linked genes are present. It is positively correlated with the gene’s predicted haploinsufficiency score of human ortholog (Pearson’s correlation coefficient and the p-value are shown). Black dots represent the five conserved genes at the strata boundaries. (f) Genes were defined as having high dosage sensitivity and high expression level when the predicted haploinsufficiency scores are larger than 0.4 and expression level (TPM) are larger than 50, respectively. The dotted line shows the average levels of autosomes. The asterisks represent significant results (p-value < 0.05) of Fisher’s exact test.

