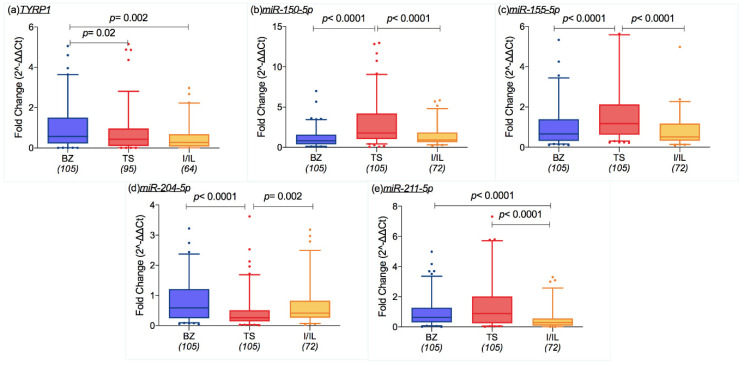
Figure 1.
Box plots representing mRNA and miRNA expression levels (ratio of threshold cycles) that were different among the geographical areas: (a) Tyrosinase related protein 1 (TYRP1) was more expressed in the cohort of South Tyrol/Bozen (BZ), than in the province of Trieste TS and in the city of Innsbruck and Innsbruck-Land district (I/IL) (p = 0.02 and p = 0.002); (b) miR-150-5p and (c) miR-155-5p were more expressed in TS samples than BZ and I/IL ones (each comparison showed p < 0.0001); (d) miR-204-5p expression is lower in TS patients in comparison to those who live in BZ and I/IL (p < 0.0001, p = 0.002, in order); (e) miR-211-5p expression was lower in I/IL than the TS and BZ groups (both p < 0.0001). The box extends from the 25th to the 75th percentiles, the middle line indicates the median and the whiskers are the 5th and 95th percentiles (Mann–Whitney test).

