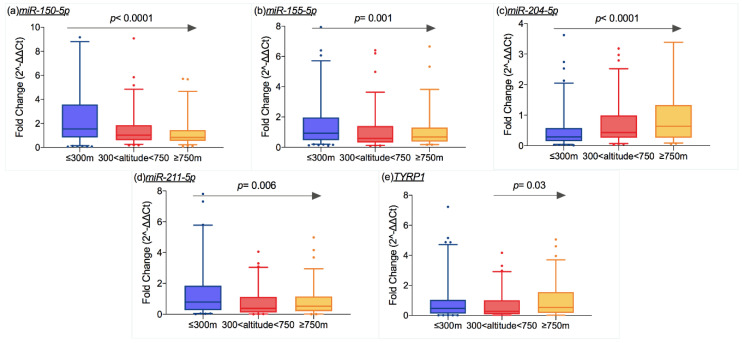
Figure 2.
Box plots representing mRNA and miRNA expression levels (ratio of threshold cycles) that were different according to the altitude of residence: the expression of (a) miR-150-5p (p < 0.0001), (b) miR-155-5p (0.001), (d) miR-211-5p (p = 0.006) decreased as altitude increased, while the opposite trend was shown by (c) miR-204-5p (p < 0.0001). (e) TYRP1 expression increase from 300 m of altitude (p = 0.03). The box extends from the 25th to the 75th percentiles, the middle line indicates the median and the whiskers are the 5th and 95th percentiles (p values on the graph refer to Spearman’s correlation test). The altitude cut-off are ≤300 m, between 300 and 750 m, and ≥750 m.

