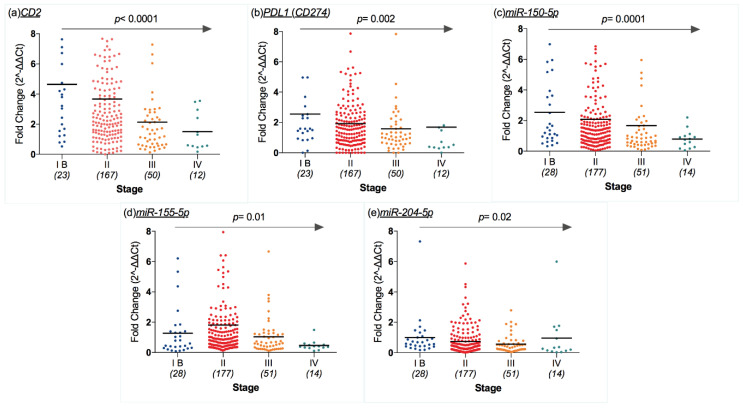
Figure 3.
Scatter dot plots representing mRNA and miRNA expression levels (ratio of threshold cycles) that were different according to cutaneous melanoma’s (CM) stage: (a) CD2, (b) CD274, (c) miR-150-5p, (d) and miR-155-5p, and (e) miR-204-5p decreased as stage progressed (p < 0.0001, p = 0.002, p = 0.0001, p = 0.01 and p = 0.02). Middle lines refer to the median value (p values on the graph refer to Spearman’s rank correlation test using CM stage as the ranking variable).

