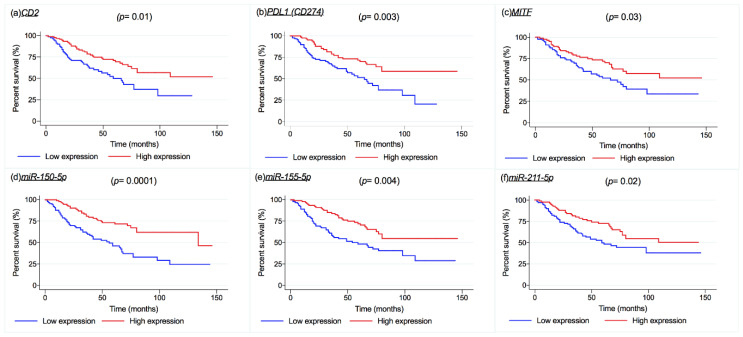
Figure 6.
Kaplan Meier survival curves for melanoma-specific survival (MSS) for CD2, p = 0.01 (a); CD274, p = 0.003 (b); MITF, p = 0.03 (c); miR-150-5p, p = 0.0001 (d); miR-155-5p, p = 0.004 (e); and miR-211-5p, p = 0.02 (f). The gene and miRNA expression were dichotomized in low expression and high expression for the median value of each transcript (p values on the graph refer to the Log-rank test).

