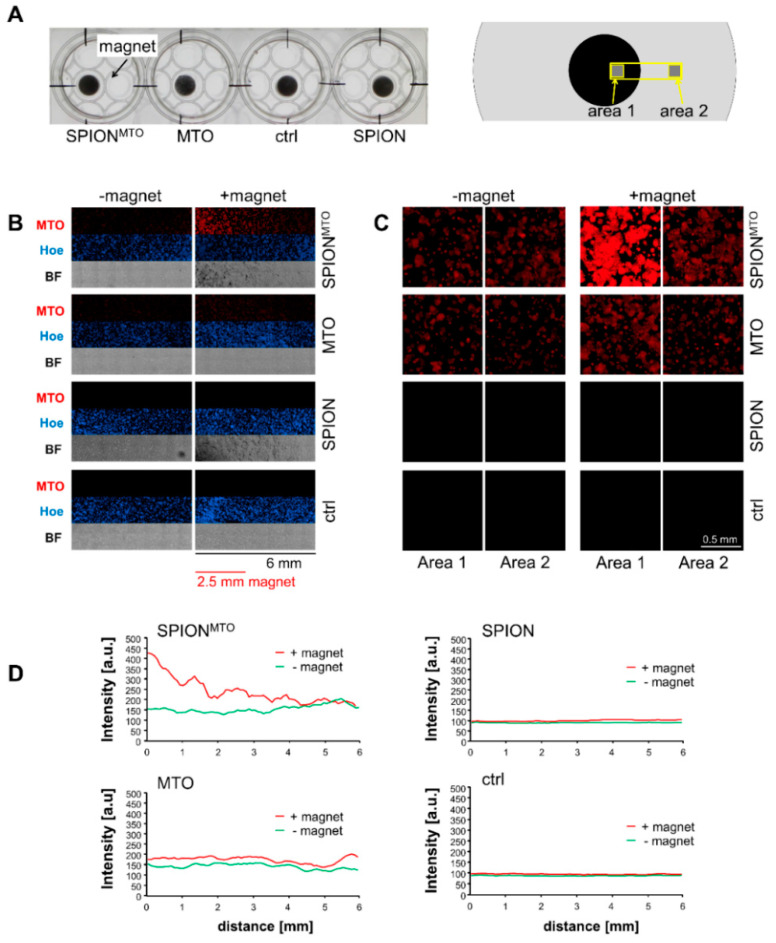
Figure 2.
Magnetic accumulation. (A) Experimental setup: HT-29 cells seeded into 12-well plates were treated with free MTO, SPIONMTO and unloaded SPIONs (MTO concentration 0.25 µM with corresponding Fe concentration, see Table 2). Magnets (diameter 0.5 cm) were placed under the cell-containing plate and incubated for 5 h. (B) Overview pictures. Cells were fixated and stained with Hoechst 33342. 8 × 3 single pictures were taken in fluorescence microscopy and stitched together, resulting in a 6 mm × 1.33 mm large area (see yellow box in (A), right scheme). (C) Close-up on areas 1 (cells above the magnet) and 2 (cells in distance to the magnet). (D) Distribution of MTO fluorescence along the analyzed area was determined with Zen software. BF: Bright field images. The experiment was performed in triplicates.

