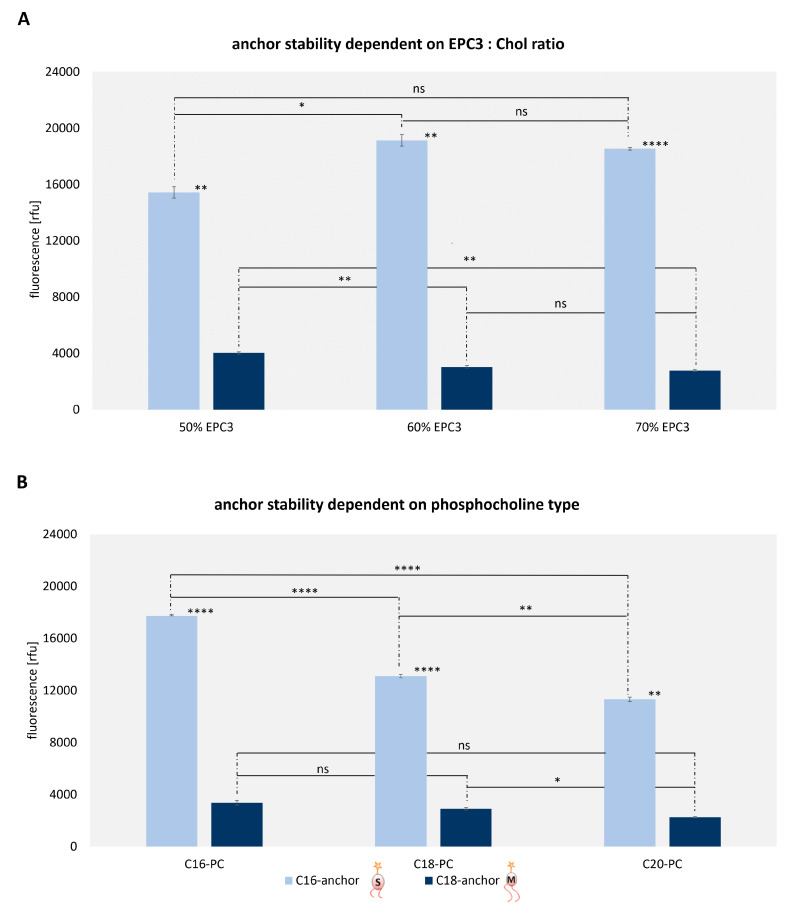
Figure 4.
Quantification of lipid exchange depending on (A) the EPC3: Chol (cholesterol) ratio (B) and on the carbon atom number of phosphocholines used for liposome preparation. 1.0 × 10⁵ UKRV Mel-15a cells were incubated with 5 vol-% atto 488 linked liposomes and cytochalasin D at 37 °C and fixed with a 4% formaldehyde solution before flow cytometric analysis. The significance between two values is illustrated by * p = 0.05–0.01, ** p < 0.001, **** p > 0.0001 and ns = no significance. The statistically significant was calculated using the Welch and Brown–Forsythe version of the one-way ANOVA test.

