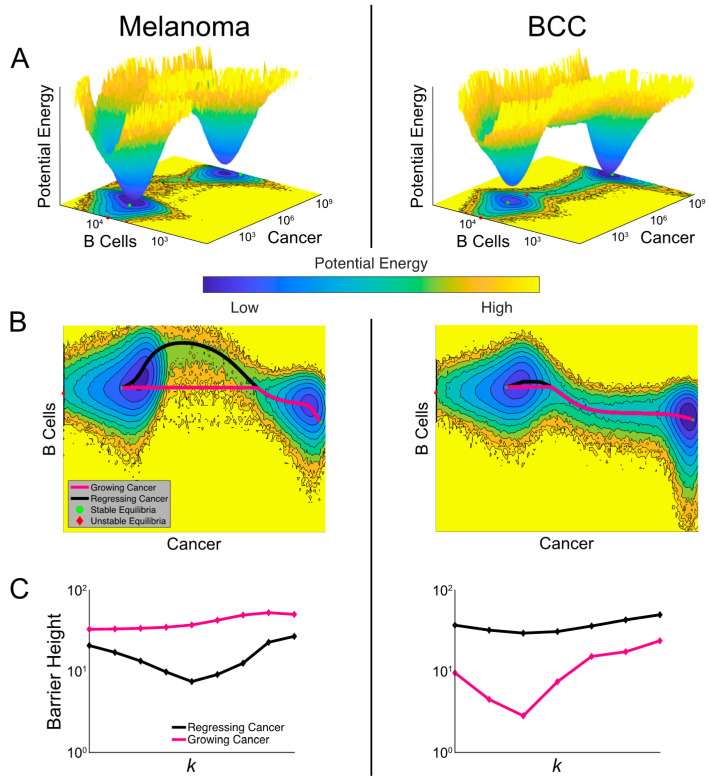
Figure 6.
Comparisons of landscapes and transition paths for melanoma and BCC potentially explain the refractory response to checkpoint therapy in BCC. (A) Cancer-state energy landscape of both cancers with k = 1.8 × 10⁻⁴ and de = 1. Lower values indicate a higher probability of finding the system in that state. These values represent marginal potential energies, having marginalized over macrophages. A contour plot is shown below along with the ordinary differential equation (ODE)-determined equilibria, both stable (green dots) and unstable (red diamonds). (B) The transition paths between the stable equilibria plotted over the contour plots from (A). The black path is for regressing cancer and the magenta path is for growing cancer. (C) The barrier height between the two high-burden and low-burden cancer states as it varies with the killing rate k. The black curve shows the variation of the barrier height for regressing cancer and the magenta for growing cancer.

