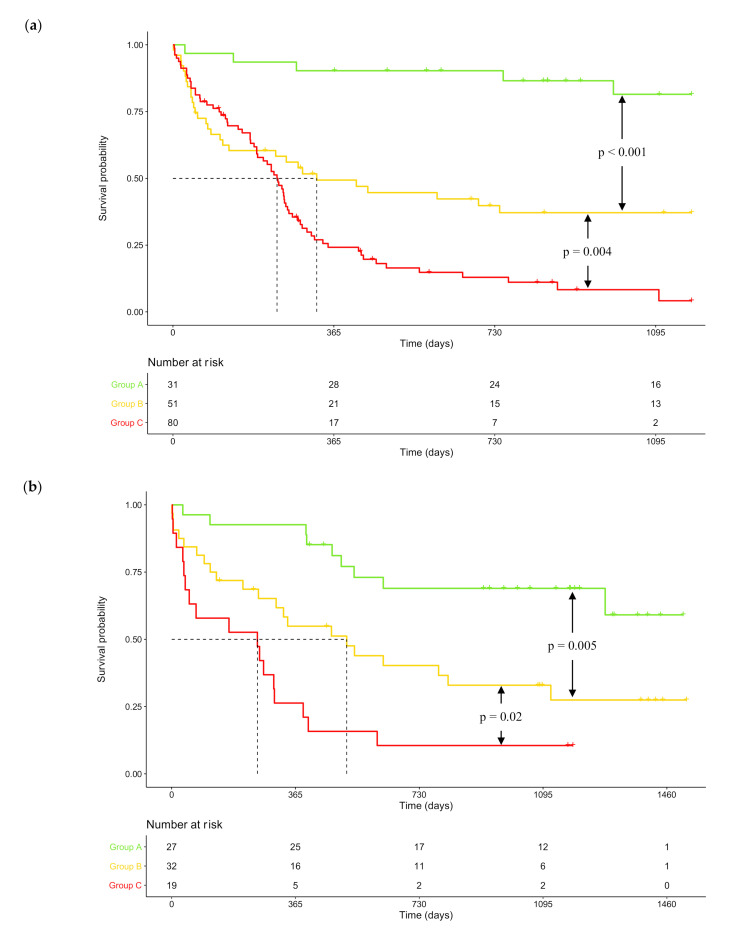
Figure 3.
Kaplan–Meier survival curves according to risk groups determined by combined score incorporating DNA repair score and NPM1/FLT3 mutational status. (a) Kaplan–Meier survival curve in the training cohort (n = 162). Median OS was not reached (95% CI: NR-NR), 326 days (95% CI: 127–NR) and 236 days (95% CI: 190–263) respectively for patients in groups A, B and C. One-year OS was 90.3% (95% CI: 80.5–100) in group A, 49.3% (95% CI: 37.1–65.7) in group B, and 24.2% (95% CI: 16.2–36.2) in group C. (b) Kaplan–Meier survival curve in the validation cohort (n = 78). Median OS was not reached (95% CI: 1278-NR), 516 days (95% CI: 308-NR) and 253 days (95% CI: 52–403) respectively for patients in groups A, B and C. One-year OS was 92.6% (95% CI: 83.2–100) in group A, 54.9% (95% CI: 39.8–75.7) in group B, and 26.5% (95% CI: 12.4–55.8) in group C. p-values were determined with the log-rank test. NR: not reached.

