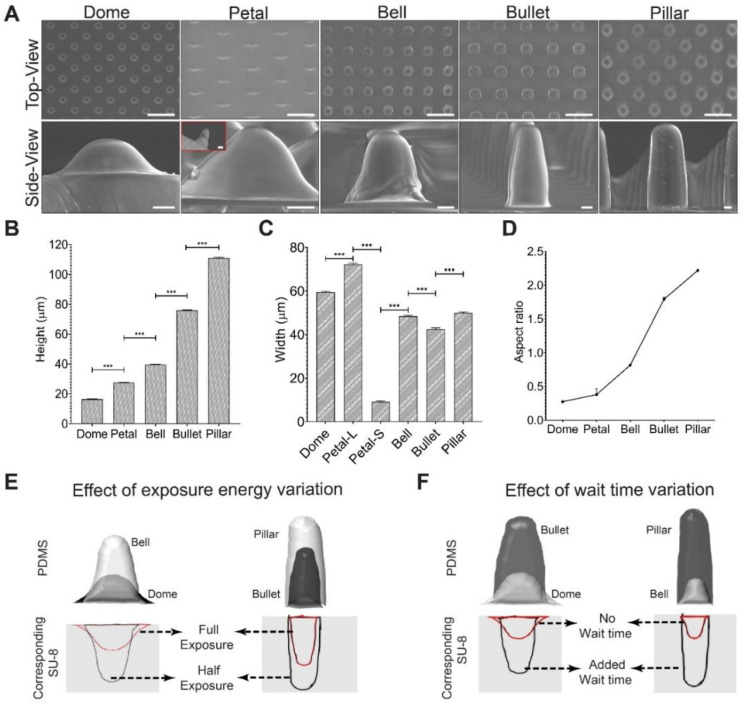
Figure 2.
SEM characterization of the PDMS-MSA shape. (A) SEM images of the various DEL-MSAs. Petal side-view inset shows the shorter width of the sample viewed from the orthogonal direction, which is much thinner and thus rendering a petal shape. The distribution of (B) heights, (C) widths and (D) the aspect ratios of all fabricated microstructures are shown. Petal is anisotropic in widths. Petal-L and Petal-S denote the longest (72.16 ± 0.612 μm) and the shortest (9.432 ± 0.17 μm) widths, respectively. (E) Effect of exposure energy on the microstructure profile. Higher exposure yielded more overcut in SU-8, resulted in shorter and more tapered MSAs. (F) Effect of wait time. The addition of wait time leads to much taller and less tapered MSAs. Error Bars: (B–D) STDEV. Statistical analysis: (B,C) Student’s t-test between groups (*** represents p < 0.001). Scale Bar: (A) top: 100 μm; bottom: 10 μm.

