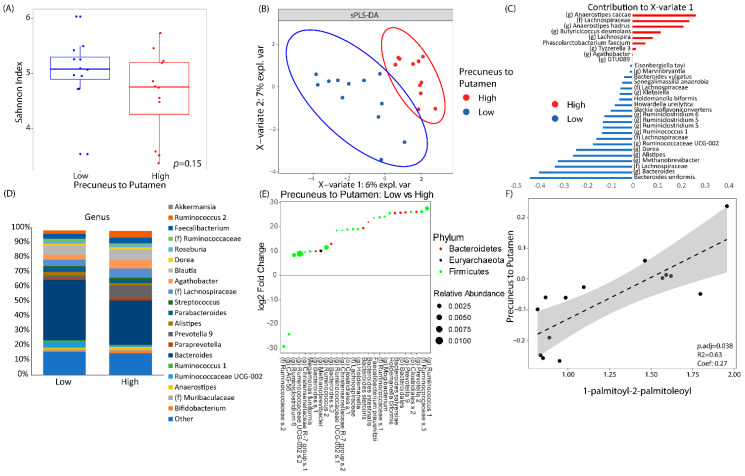
Figure 4.
Brain connectivity was associated with significant changes in the fecal microbiome and serum metabolomics. Resting-state connectivity between the precuneus and the putamen were dichotomized as either high vs low based on its median value. (A) Alpha diversity between low vs high brain connectivity as measured by Shannon Index (a metric of species evenness). (B) Sparse partial least square discriminant analysis (sPLS-DA) plot showing how the gut microbiome can discriminate between patients with low or high connectivity. (C) The amplicon sequence variants that contributed to X-variate 1 of the sPLS-DA plot. (D) Taxonomic plots by genus of microbial communities between patients with low vs high connectivity between the precuneus and the putamen. Genera are only listed if they had a relative abundance of at least 1%. (E) Differential abundance testing as performed by DESEq2 adjusting for time showing log2 fold change in microbes of patients with low connectivity versus those with high connectivity. (F) Linear correlation between resting state connectivity between the precuneus and the putamen to 1-palmitoyl-2-palmitoleoyl, a phosphatidylcholine metabolite.

