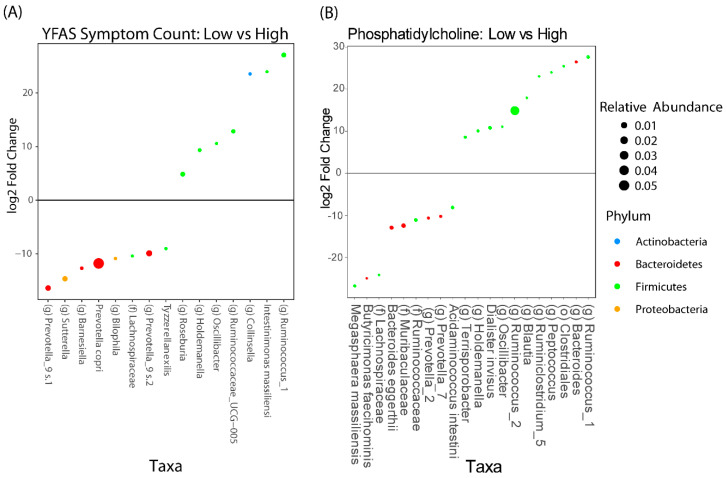
Figure 5.
DESEq2 analysis adjusted for timepoints, showing the taxa that are associated with (A) YFAS symptom count and (B) phosphatidylcholine metabolite and 1-palmitoyl-2-palmitoleoyl. Taxa that have a positive fold change are those that are associated with a lower YFAS symptom count or 1-palmitoyl-2-palmitoleoyl level, respectively.

