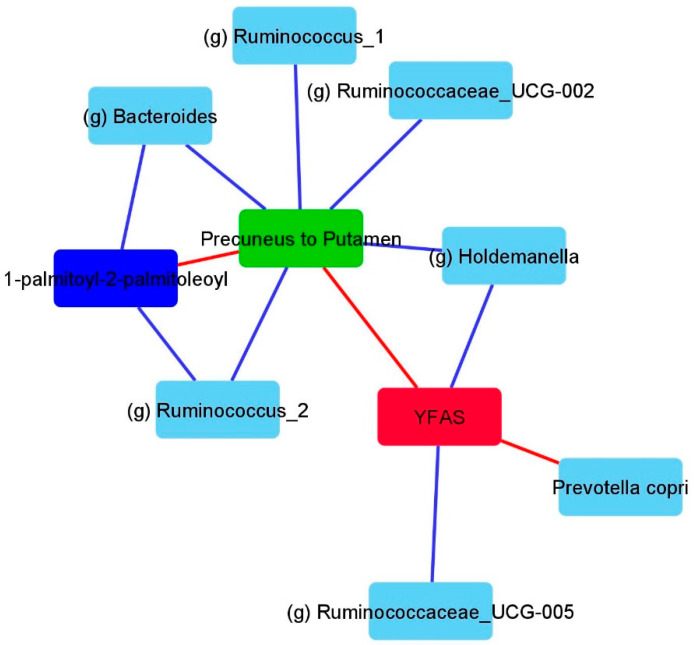
Figure 6.
Summary figure depicting a subset of the associations across brain imaging, microbiome, metabolite, and eating behavior. This figure was solely created based on analysis, as previously mentioned above. Blue lines depict negative associations and red lines depict positive associations. YFAS: Yale Food Addiction Score.

