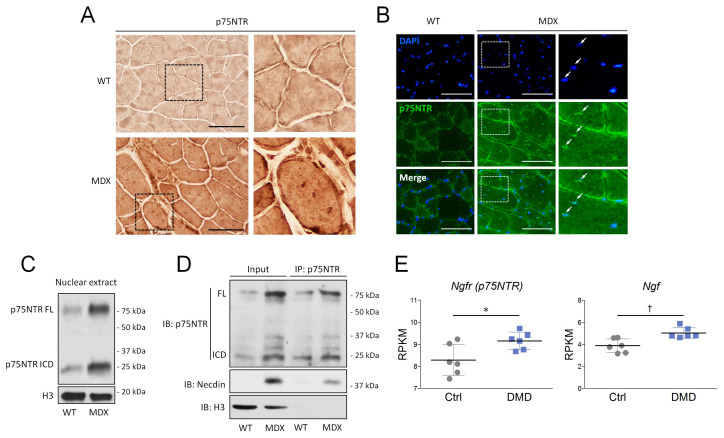
Figure 9.
The p75NTR localization and expression in dystrophic muscles from mdx and Duchenne muscular dystrophy (DMD) patients. (A) Overview of p75NTR in cross-sections of TA muscles from wild-type (WT) and mdx mice. N = 3 for each experimental group. Scale bar: 100 μm. (B) Immunofluorescence analysis of p75NTR (green) expression in TA muscles from WT and mdx animals. DAPI was used to counterstain the nuclei. Nuclear co-localization between p75NTR immunoreactivity and DAPI was indicated by white arrows. N = 3 for each experimental group. Scale bar: 100 μm. (C) Western blot of p75NTR in the nuclear fraction from WT and mdx muscles. H3 was used as the protein loading control for the nuclear extract. (D) Western blot showing p75NTR/necdin interaction by co-immunoprecipitation experiments. Nuclear extract from WT and mdx muscles were incubated with anti-p75NTR antibody produced in rabbit. Immunoprecipitation was then analyzed for p75NTR and necdin expression by using anti-p75NTR antibody produced in mouse and anti-necdin produced in rabbit. Anti-Rabbit IgG HRP “True blot” were used to visualize co-immunoprecipitated necdin. H3 was used as protein loading control for nuclear extracts. (E) RPKM expression levels of ngfr (p75NTR) and of ngf transcripts in previously reported RNA-Seq dataset from healthy individuals (Ctrl, N = 6) and DMD patients (N = 6). Data are expressed as the mean ± SD. Statistical analysis was performed by using the Student’s t test. * p < 0.05; † p < 0.01. FL = full-length; ICD = intracellular domain.

