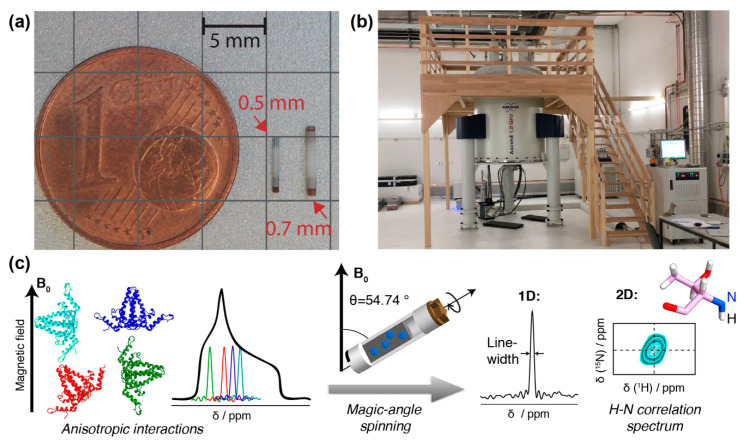
Figure 1.
NMR rotors, spectrometer and resonance signals: (a) NMR rotors for fast spinning: 110 kHz for 0.7 mm rotor, 150 kHz for 0.5 mm (picture courtesy of Susanne Penzel). (b) 1200 MHz magnet for solid-state NMR at ETH Zurich. (c) Schematic representation of anisotropic interactions arising from different orientation of the individual molecules with respect to the magnetic field. The superposition of all possible chemical shifts gives rise to broad peaks with a characteristic shape, the powder pattern. The anisotropic interactions can be averaged out using MAS, which results in a single resonance line centered at the isotropic chemical shift of the spin. In addition, spinning sidebands may appear. This spin can be correlated to a neighboring spin, in the example, the amide 1H to the amide 15N. Two-dimensional spectroscopy then shows peaks which represent, for the present example, the amide proton frequency in one dimension, and the nitrogen frequency in the other. Such a signal will be observed for every NH pair in the protein. The resonance-line position is given by the isotropic part of NMR chemical shift and is usually specified in ppm (parts per million) of the resonance frequency. To obtain high-resolution spectra, the linewidth should be as narrow as possible, as this allows to distinguish (resolve) a maximum of resonances. A narrowing of linewidths can be achieved by (i) using a spectrometer operating at a higher magnetic field, (ii) improving sample homogeneity and symmetry, and (iii) reducing the dipolar coupling interactions by decreasing the density of protons in the system (through protein deuteration, for example) and/or increasing the MAS frequency by using smaller diameter rotors.

