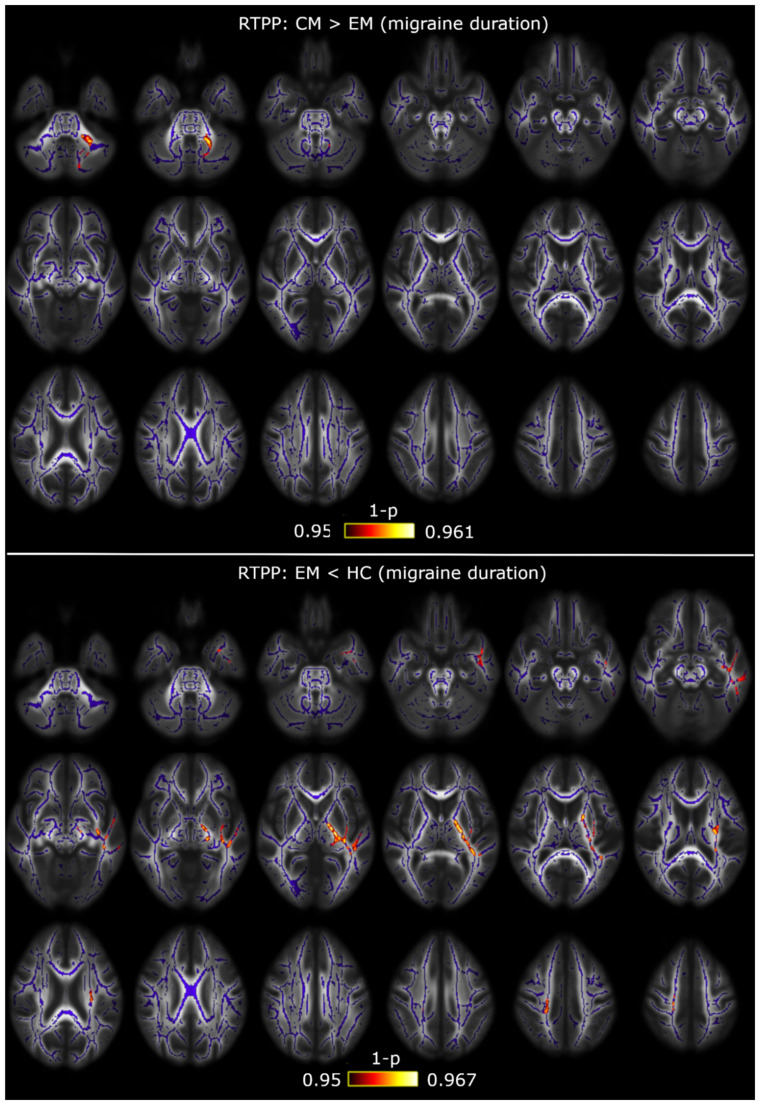
Figure A1.
RTPP alterations between CM and EM including the duration of the migraine as a covariate. TBSS showed increased RTPP values in CM with respect to EM in the middle cerebellar peduncle (top) and decreased RTPP values in EM compared to HC throughout the left hemisphere and the corona radiata (bottom). The white matter skeleton is shown in blue, and voxels with the lowest p-values in red-yellow. The color bar shows the 1-p-values (FWE-corrected).

