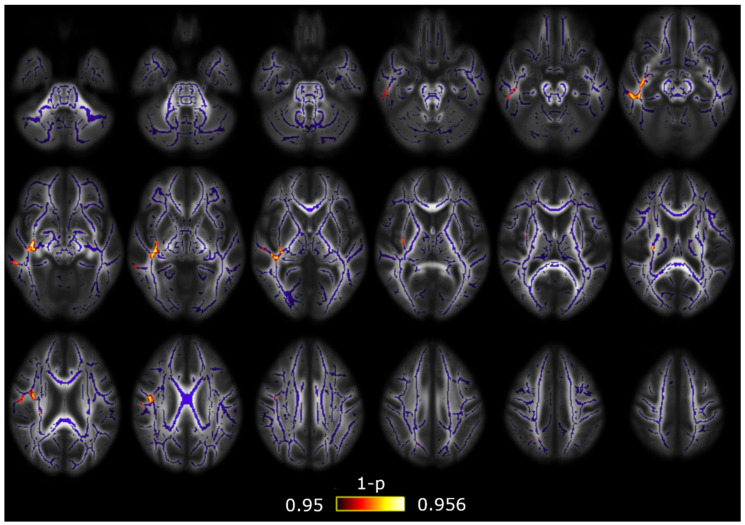
Figure A2.
RTAP alterations between CM and HC including time from onset of CM as a covariate. TBSS showed decreased RTAP values in CM with respect to HC throughout the right hemisphere. The white matter skeleton is shown in blue, and voxels with the lowest p-values in red-yellow. The color bar shows the 1-p-values (FWE-corrected).

