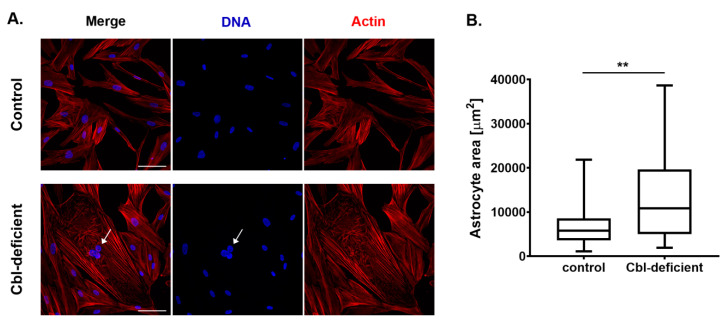
Figure 3.
Hypovitaminosis B12 results in astrocytes hypertrophy. (A) Representative confocal images of control and cobalamin-deficient normal human astrocytes; arrows indicate multinucleation; scale bar shows 100 µm. (B) Cell size (area) was evaluated from the confocal images. Data acquired from at least three independent experiments are presented as box plots. The boxes show, from bottom to top, the 25th percentile, median, and 75th percentile values, and the whiskers indicate the maximum and minimum values. More than 300 cells from different randomly selected microscope fields are analyzed for each condition. The cells that were fully visible were bordered manually and the area of the cell body was determined using ImageJ software. Statistically significant differences are designated as ** p < 0.01 for comparisons between groups using unpaired t-test.

