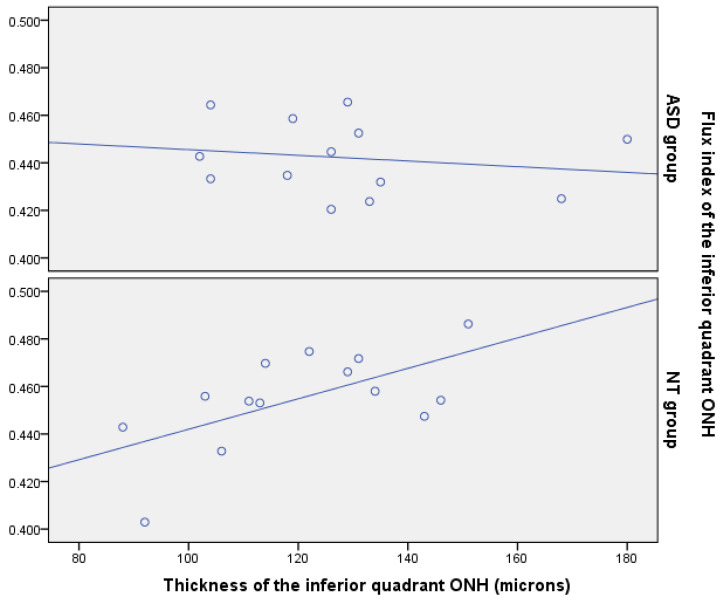
Figure 14.
Scatterplots representing the association between peripapillary retinal nerve fiber layer (RNFL) thickness and flux index at the inferior peripapillary quadrant in autism spectrum disorder (ASD) group and neurotypical group (NT). Each point represents the left eye value of each patient. ONH = optic nerve head. Best correlation lines have been added.

