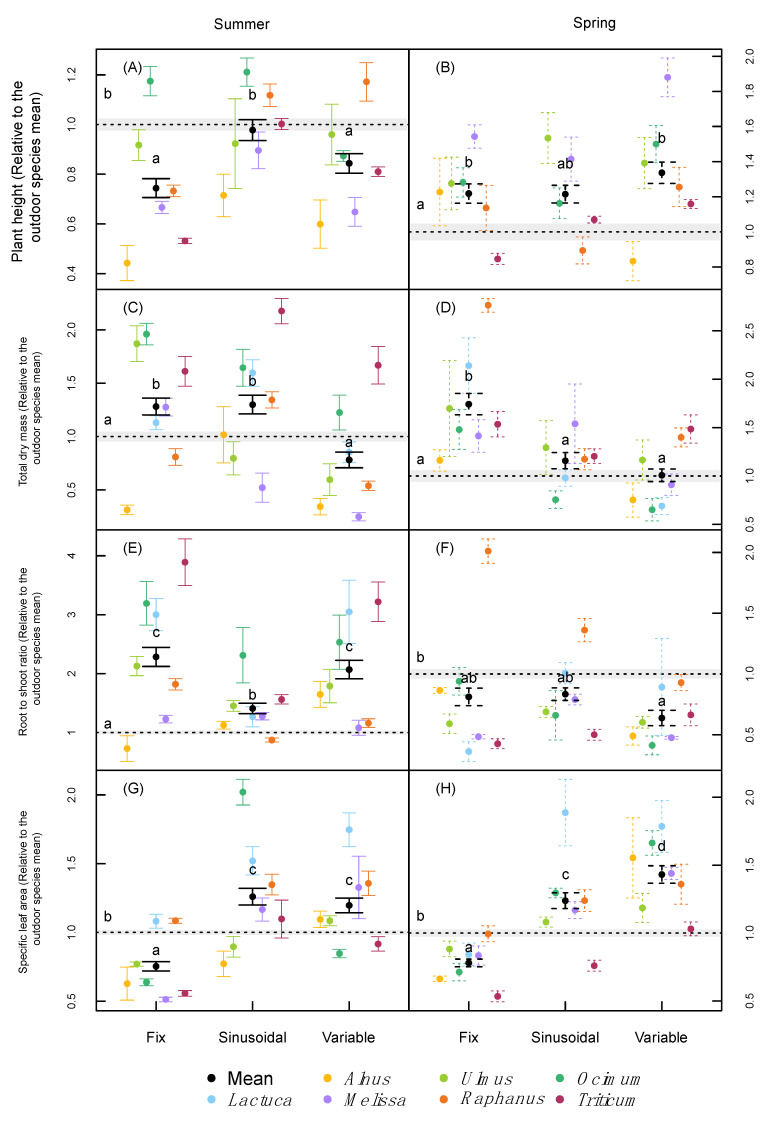
Figure 2.
Plant height (A,B), total plant dry mass (C,D), root to shoot ratio (E,F), and specific leaf area (G,H) of the difference species normalized relative to the outdoor species mean under the two different runs (summer and spring). Error bars correspond to the standard error. n = 9 for each species. Letters indicate significant differences (p < 0.05, based on Tukey’s post-hoc tests) among treatments (including the outdoor trials) using species as a random effect, separately for each run. Alnus was not included in the spring trial under the sinusoidal treatment.

