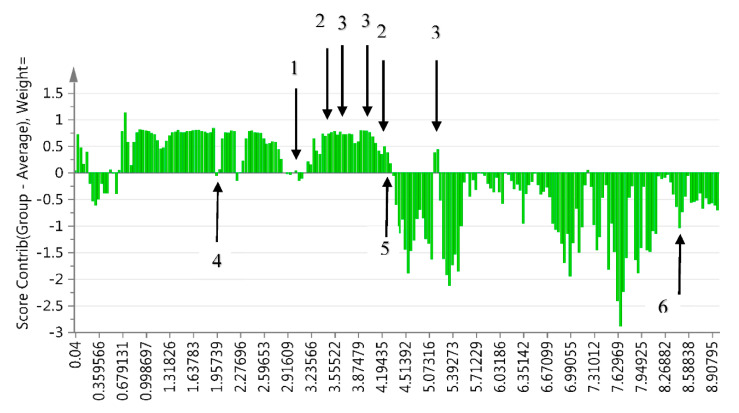
Figure 2.
Contribution plot representing the differences between Burkea versus non-Burkea soils showing regions with positive correlation with Burkea soils for choline-like (1) (3.1 ppm), carnitine-like (1) (3.1 ppm), betaine (2) (3.3 and 3.9 ppm) and trehalose (3) (3.6, 3.8, 3.9 and 5.2 ppm) compounds and negative association for acetate (4) (1.9 ppm), lactate (5) (4.1 ppm) and formate (6) (8.4 ppm).

