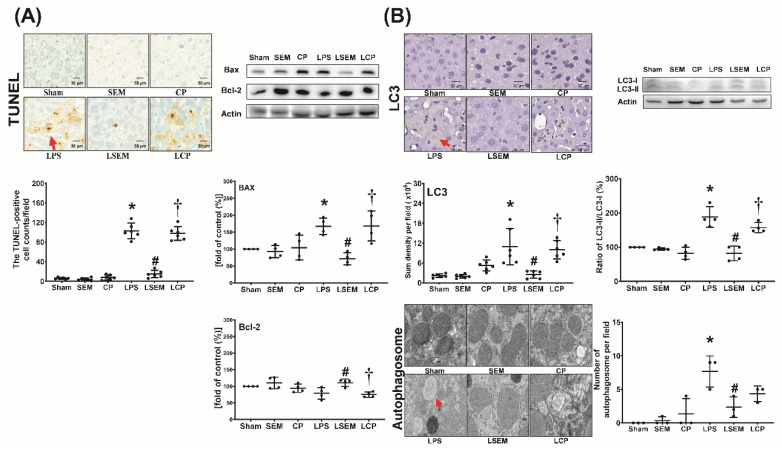
Figure 6.
SEM18 peptide mitigates endotoxin-induced (A) apoptosis and (B) autophagy upregulation in the liver, as measured at 24 h after lipopolysaccharide (LPS) or normal saline (NS) administration. (A) Representative microscopic images of DNA fragmentation (red arrow) in liver tissues (200×) assayed using terminal deoxynucleotidyl transferase dUTP nick-end labeling (TUNEL) method and the mean TUNEL-positive cell counts (per 0.25 mm2). Representative gel photography of apoptosis-related proteins (i.e., the proapoptotic Bax and the antiapoptotic Bcl-2) and actin (the internal standard) in liver tissues assayed using immunoblotting assay and the band densities of Bax/actin and Bcl-2/actin. (B) Representative microscopic images of microtubule-associated protein 1A/1B-light chain 3 (LC3, red arrow) in liver tissues (200×) measured using immunohistochemistry assay and the quantitative sum intensity of LC3. Representative gel photography of LC3-I, LC3-II, and actin (the internal standard) in liver tissues and LC3-II/LC3-I ratio. Representative transmission electron microscopic images of autophagosome (red arrow) in liver tissues (6000×) and the mean autophagosome numbers (per 2 μm2). Sham: the NS group; SEM: the NS plus SEM18 peptide group; CP: the NS plus control peptide (CP) group; LPS: the lipopolysaccharide (15 mg/kg) group; LSEM: the LPS (15 mg/kg) plus SEM18 peptide group; LCP: the LPS (15 mg/kg) plus CP group. Data are the mean ± standard deviation. Data of immunohistochemistry staining assay, immunoblotting assay, and transmission electron microscopic were derived from five, four, and three mice from each group, respectively. * p < 0.05, the LPS group vs. the sham group; # p < 0.05, the LSEM group vs. the LPS group; † p < 0.05, the LCP group vs. the LSEM group.

