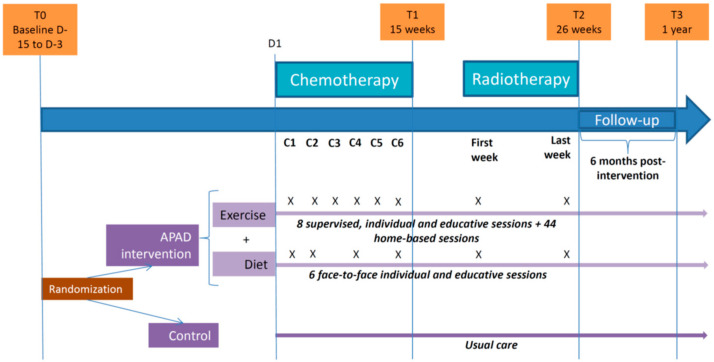
Figure 1.
Flow diagram of the Adapted Physical Activity Diet 2 (APAD2) trial. C indicates chemotherapy cycle time points. X indicates intervention times in the associated randomization arm. Number of participating patients: T0 (Baseline): Control (n = 180), Adapted Physical Activity Diet (APAD) (n = 180). T2 (completed Chemotherapy and Radiotherapy sessions): Control (n = 170), APAD (n = 160). T3 (1 year after inclusion): Control (n = 157), APAD (n = 144).

