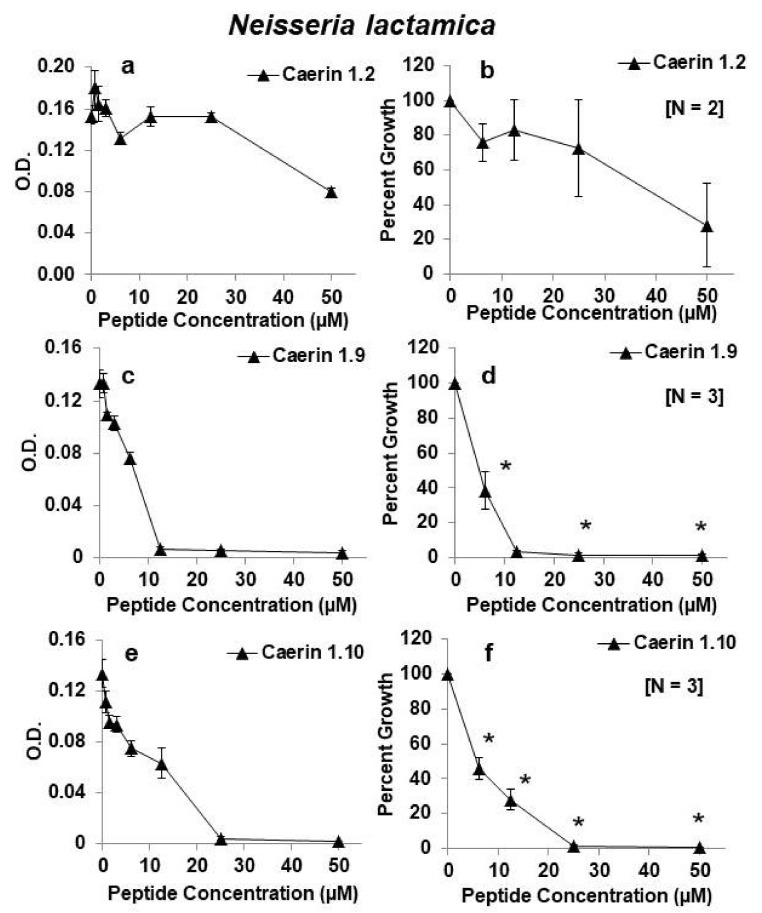
Figure 7.
Effects of caerin 1 peptides on growth of Neisseria lactamica. (a,b) caerin 1.2; (c,d) caerin 1.9; (e,f) caerin 1.10. Panels on the left show growth as changes in optical density (O.D.) at 630 nm for one representative experiment testing the peptides at increasing 2-fold concentrations from 0.8 to 50 µM. Panels on the right show the average as percent growth in comparison with the positive (no peptide) control set at 100% for replicate experiments for the range of concentrations from 6.25–50 µM. The number of replicate experiments for each peptide is shown in brackets within the panel. * Significantly different growth in comparison with the positive control, p < 0.01 by one-way ANOVA with Tukey’s post hoc test.

