Figure 2.
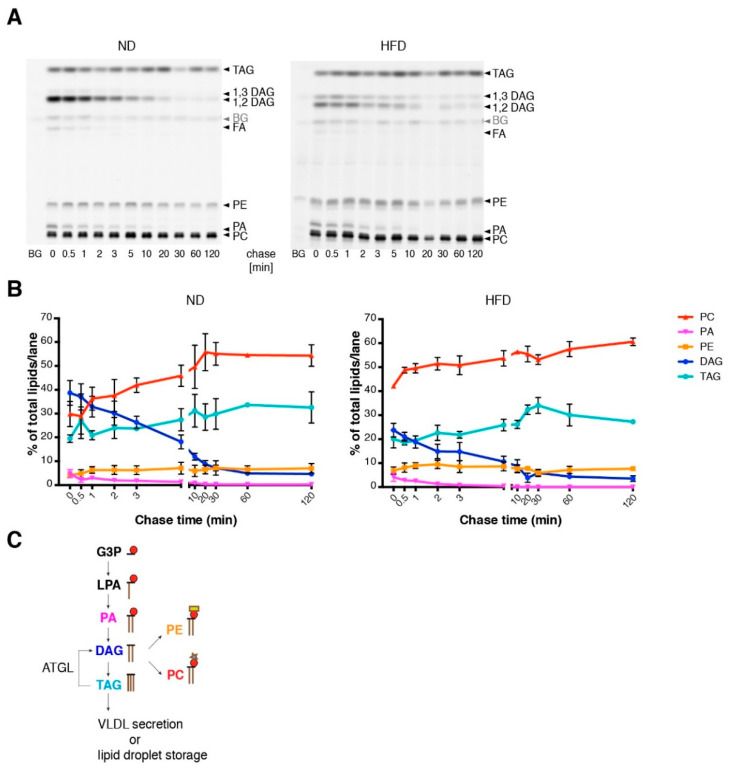
Lipid metabolism in isolated hepatocytes of ND and HFD mice. (A) Hepatocytes from ND or HFD mice were cultured for 2 h prior to pulse-chase experiments. After pulse incubation (2 min) with alkyne fatty acids, hepatocytes were washed and subsequently incubated with chase medium for the indicated time. Lipids were extracted and the extracts click-reacted with the dye azidocoumarin. Lipids were separated on a thin layer chromatography (TLC) plate and metabolites of alkyne fatty acids were detected by fluorescence imaging. Metabolites were identified by co-migrating standards. (B) Quantification of the TLC plates shown in panel A. Numbers indicate the percentage of the respective lipid class relative to total labeled lipid per lane (n ≥ 3). (C) Metabolic flow of fatty acids in the liver starting with the incorporation of acyl-CoA into glycerol-3-phosphate (G3P), lysophosphatidic acid (LPA), phosphatidic acid (PA) and ending with either the incorporation into triacylglycerol (TAG) or into the phospholipids phosphatidylcholine (PC) or phosphatidylethanolamine (PE). Lipolytic action of the enzyme ATGL (adipose TAG lipase) leads to the formation of diacylglycerol (DAG) from TAG. Mean values with SEM of triplicate determinations are shown. BG: background.

