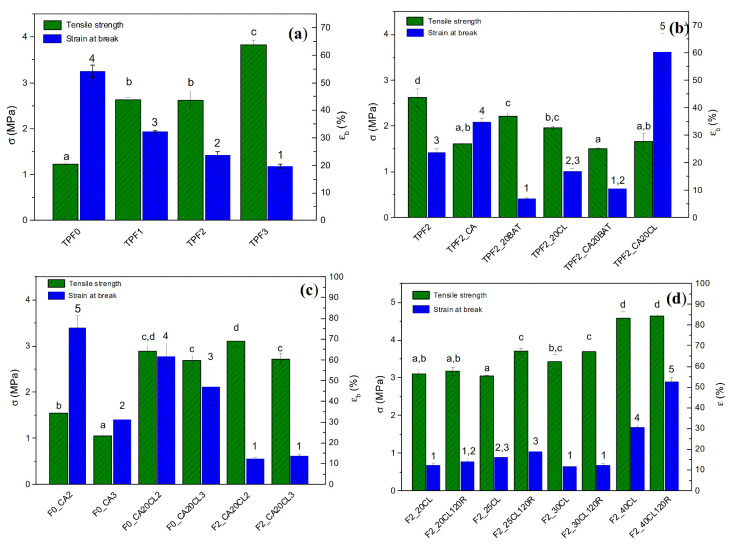
Figure 4.
Results of tensile strength and strain at break for (a) TPWF/bran film samples, (b) TPWF/bran and biopolymeric blends, (c) samples processed with two different plasticization temperature profiles (T2, T3), (d) samples processed with two different mixing rates (30 rpm, 120 rpm). (a–d, stress values) (1–5, strain values) Different superscripts within the same column group (stress or strain values) indicate significant differences among formulations (p < 0.05).

