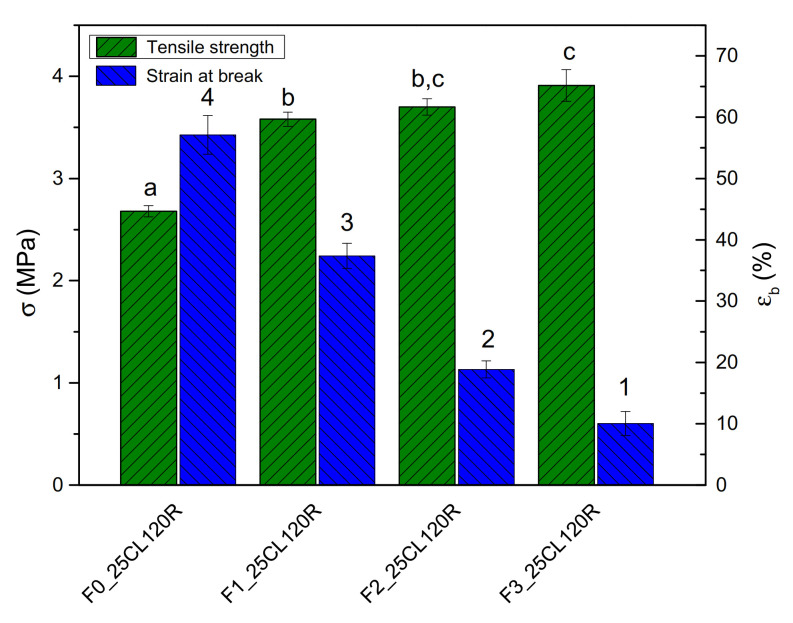
Figure 6.
Results of tensile strength and strain at break for TPWF/PCL blends based on F0, F1 and F3 flours, containing 25% wt. of PCL and processed at 120 rpm. (a–c, stress values) (1–4, strain values) Different superscripts within the same column group (stress or strain values) indicate significant differences among formulations (p < 0.05).

