Figure 8.

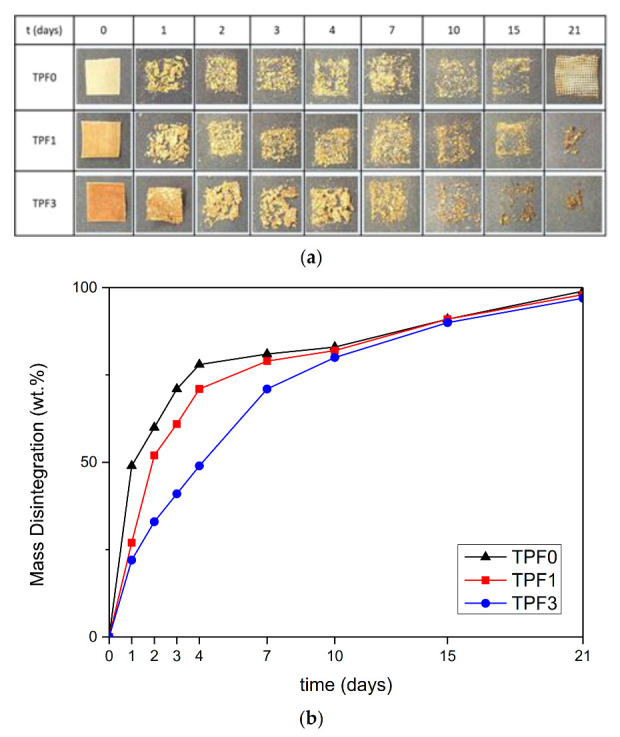
Visual images of the TPWF samples based on F0, F1 and F3 flours (a) and evolution of disintegration degree (b) at different compositing times.

Visual images of the TPWF samples based on F0, F1 and F3 flours (a) and evolution of disintegration degree (b) at different compositing times.