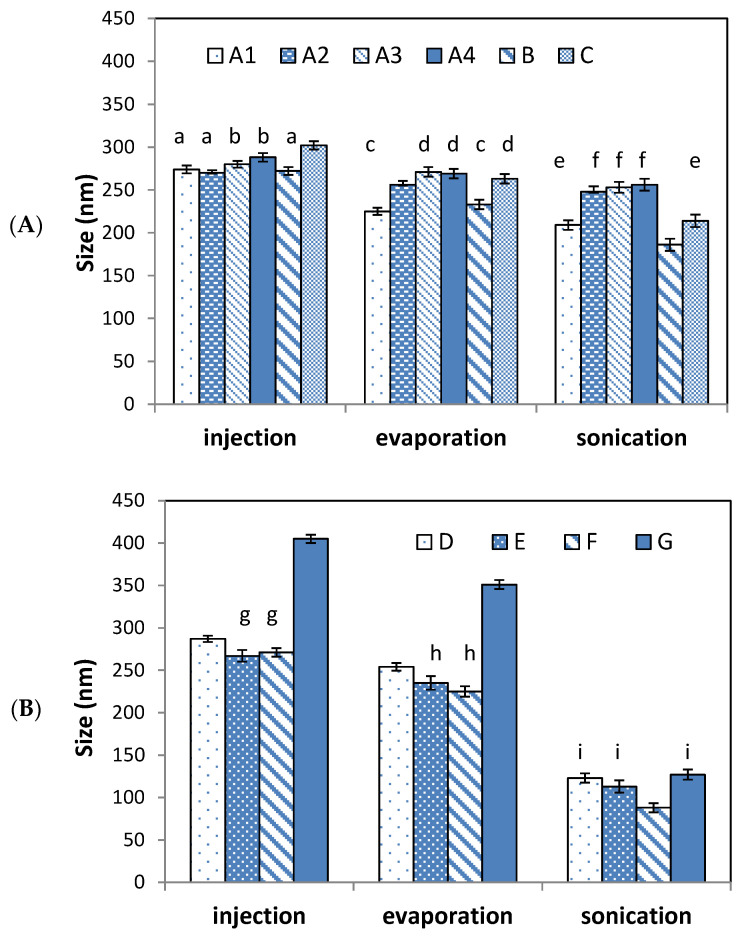
Figure 3.
Mean particle size after each step of ethanol injection (EI) method for the preparation of niosomes (A) and transfersomes (B). The error bar corresponds to the standard deviation of triplicate samples. Figure shows significant differences (p < 0.05) after each preparation step for all samples. Same letters indicate samples without significant differences (p > 0.05) among them.

