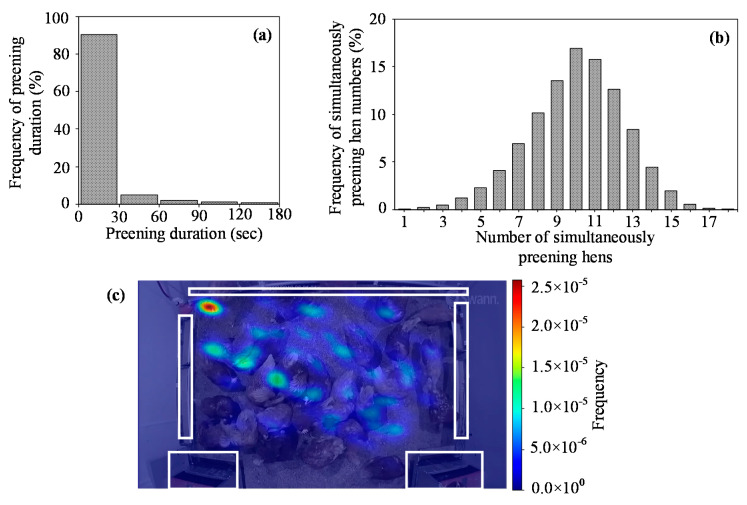
Figure 8.
Preening behavior measurement during 6:00–6:30 am for 38-week-old hens. (a) Frequency of preening duration. (b) Frequency of simultaneously preening numbers. (c) Heat map for the location of preening birds. The drinker, feeder and nest box are marked as the white rectangles on the top, middle and bottom, respectively. The non-unit frequency represents the probability for birds preening at specific locations and is calculated by Standard Gaussian Kernel Density Estimation Function.

