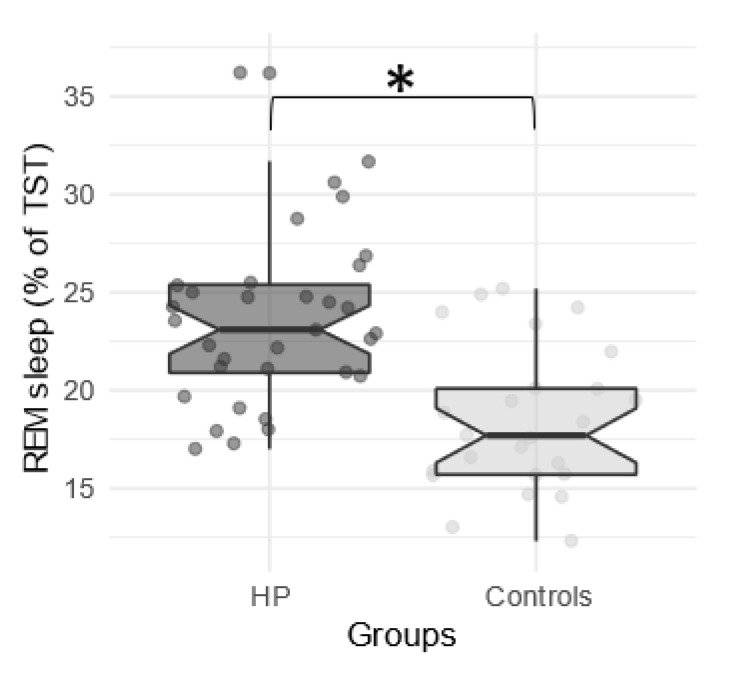
Figure 1.
Each point represents the median Rapid Eye Movement (REM) sleep percentage for each subject according to the group (High Potential (HP) vs. controls). The central line of the boxplot corresponds to the median; the upper and lower parts correspond to the first and third quartiles. Difference between groups is represented by a star: * p < 0.05.

