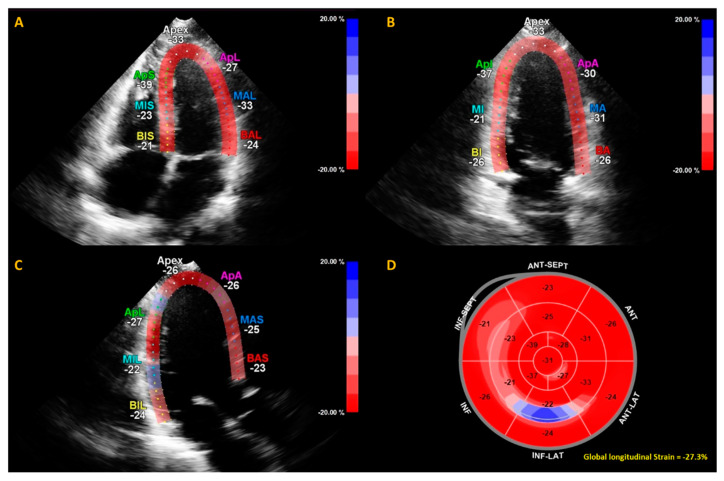
Figure 2.
Example of calculation of global longitudinal strain (GLS) by speckle tracking for the apical four-, three- and two-chamber views (A–C). The strain during one cardiac cycle is shown for each of the color-coded (red and blue) left ventricular segments. The longitudinal strain bull’s eye plot (D) determined from 2D speckle tracking imaging offers a visual overview of the regional and global left ventricular myocardial function in a diagram. In this example of one of the subjects in this study, the GLS is −27.3%, which is in the normal range.

