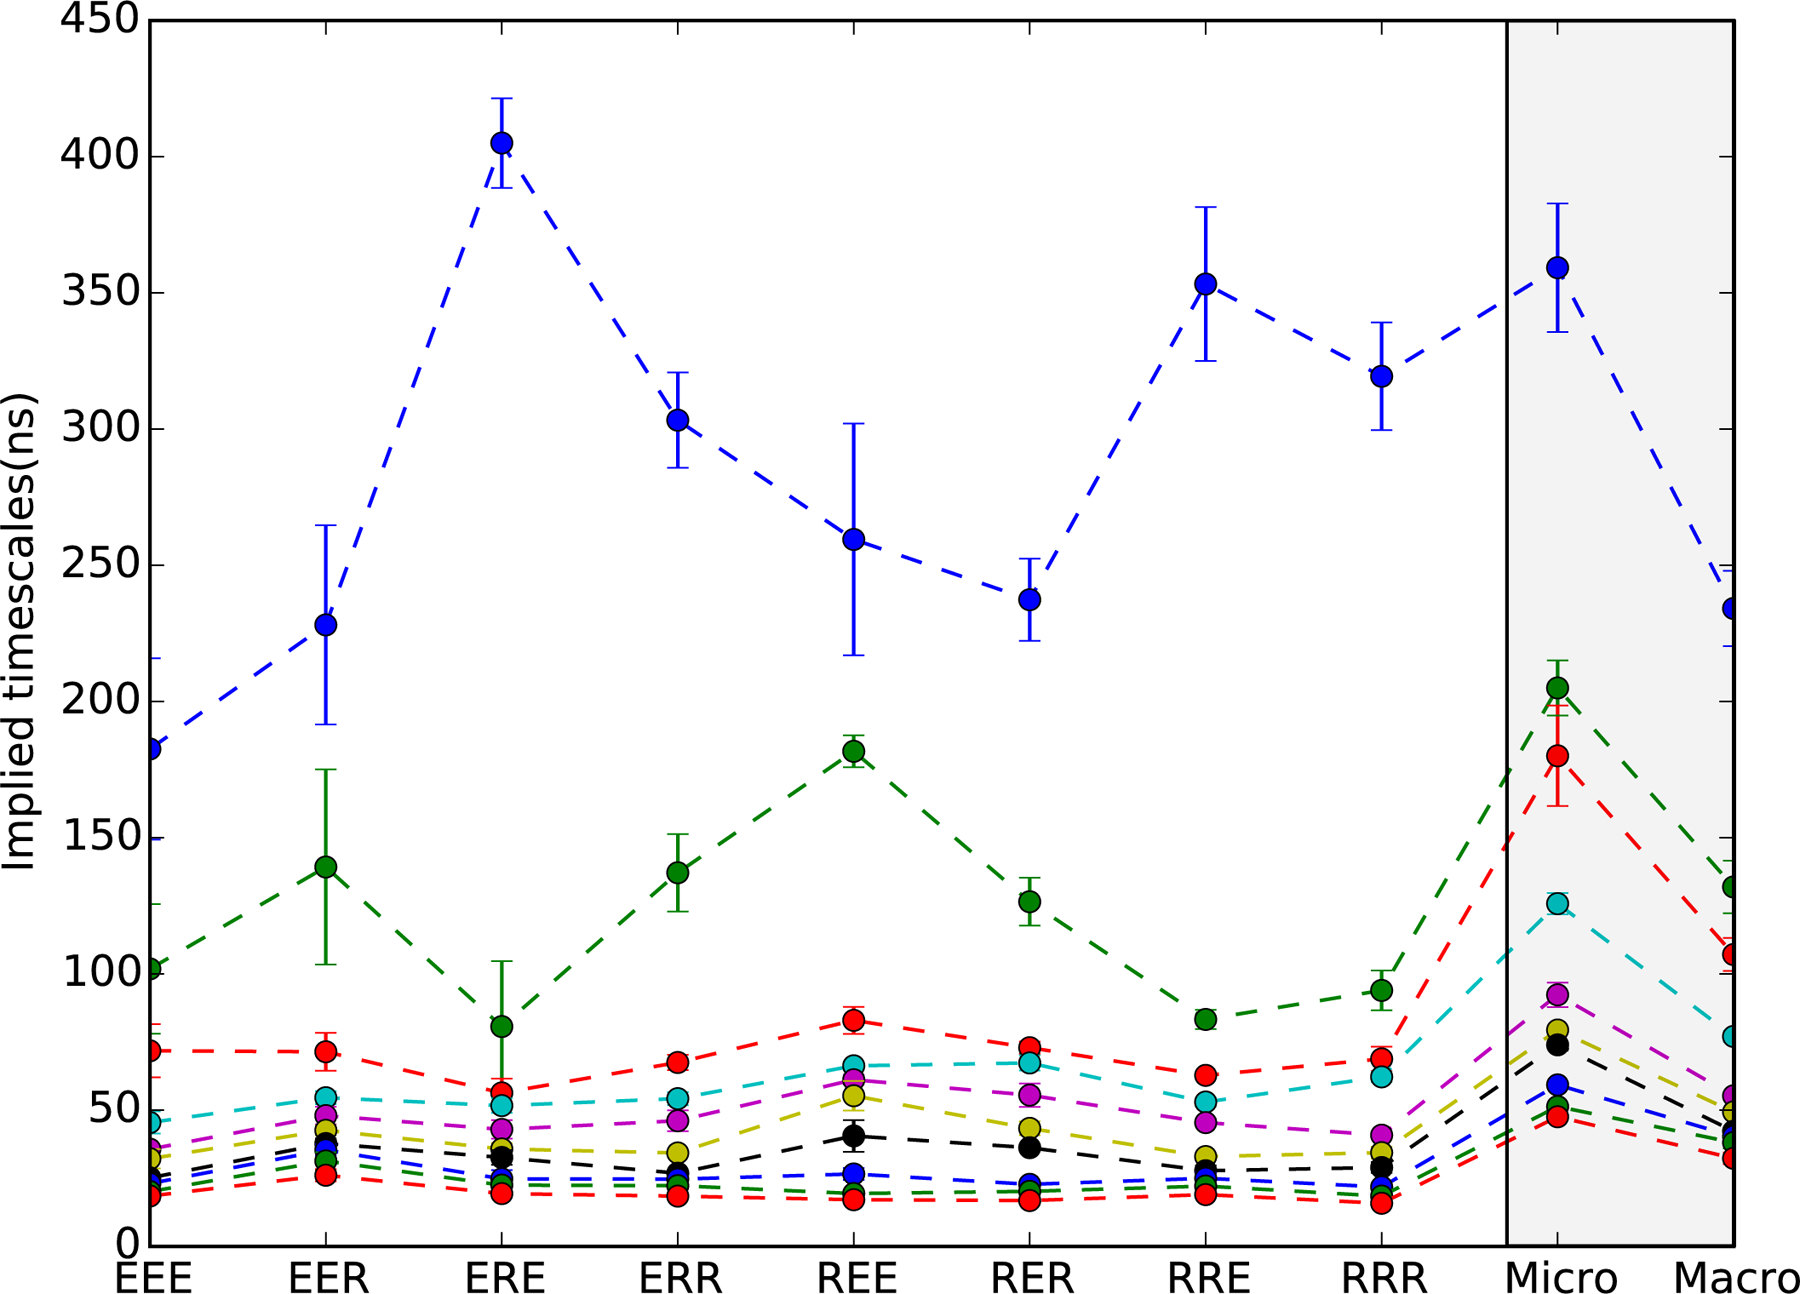
Figure 2:

Implied timescale spectra of 40-macrostate MSMs for all eight protein sequences. Shown are the ten slowest timescales with error bars denoting uncertainties estimated from ten-fold cross-validation. Dashed lines are to guide the eye. For all sequences, the slowest timescale is well-separated from the rest, indicative of two-state helix folding. Sequences containing R14 (Fs-ERE, ERR, RRE and RRR) have slower folding times than those containing E14, with the greatest difference seen for Fs-EEE (~180 ns) versus Fs-ERE (~400 ns). On the right (gray panel) is shown a comparison of implied timescales for 1200-microstate and 40-macrostate MSMs built from the combined sequence data. Only a slight acceleration in timescales is seen in the macrostate model, indicating very modest artifacts due to coarse-graining.
