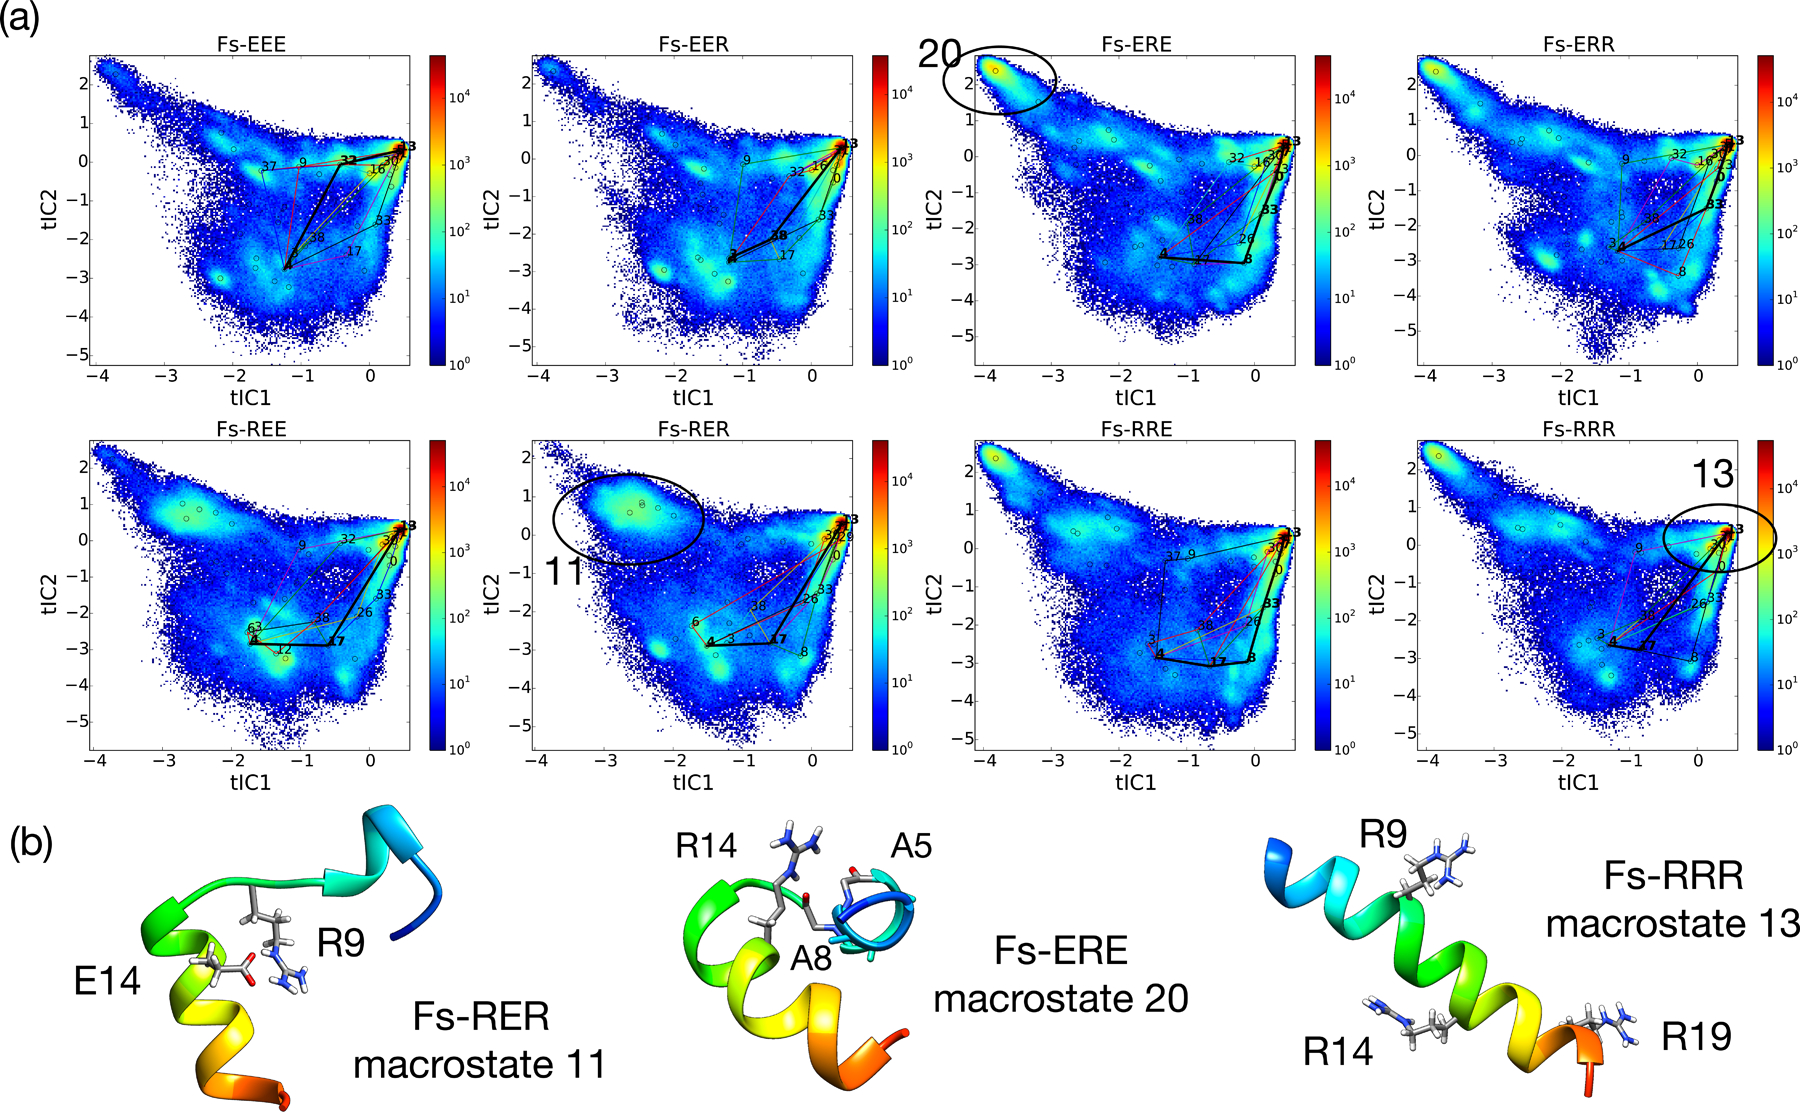
Figure 3:

The tICA landscapes of all eight sequences reveal the importance of metastable states with non-native salt-bridges. (a) For each sequence is shown a population density heat-map of simulation snapshots projected to the 2D tICA landscape defined by components tIC1 and tIC2. Open circles denote the cluster center of each of the 40 macrostates. Superimposed on the tICA landscape are pathways showing the ten highest-flux routes from an unstructured macrostate to the native folded state, with the highest-flux path displayed using a black bold line. Macrostates that participate in these pathways are labeled by macrostate index. (b) Representative structures of key macrostates stabilized by non-native salt-bridges (macrostates 11 and 20), and the native-state macrostate 13. The corresponding regions of the tICA landscape for these macrostates are circled and labeled.
