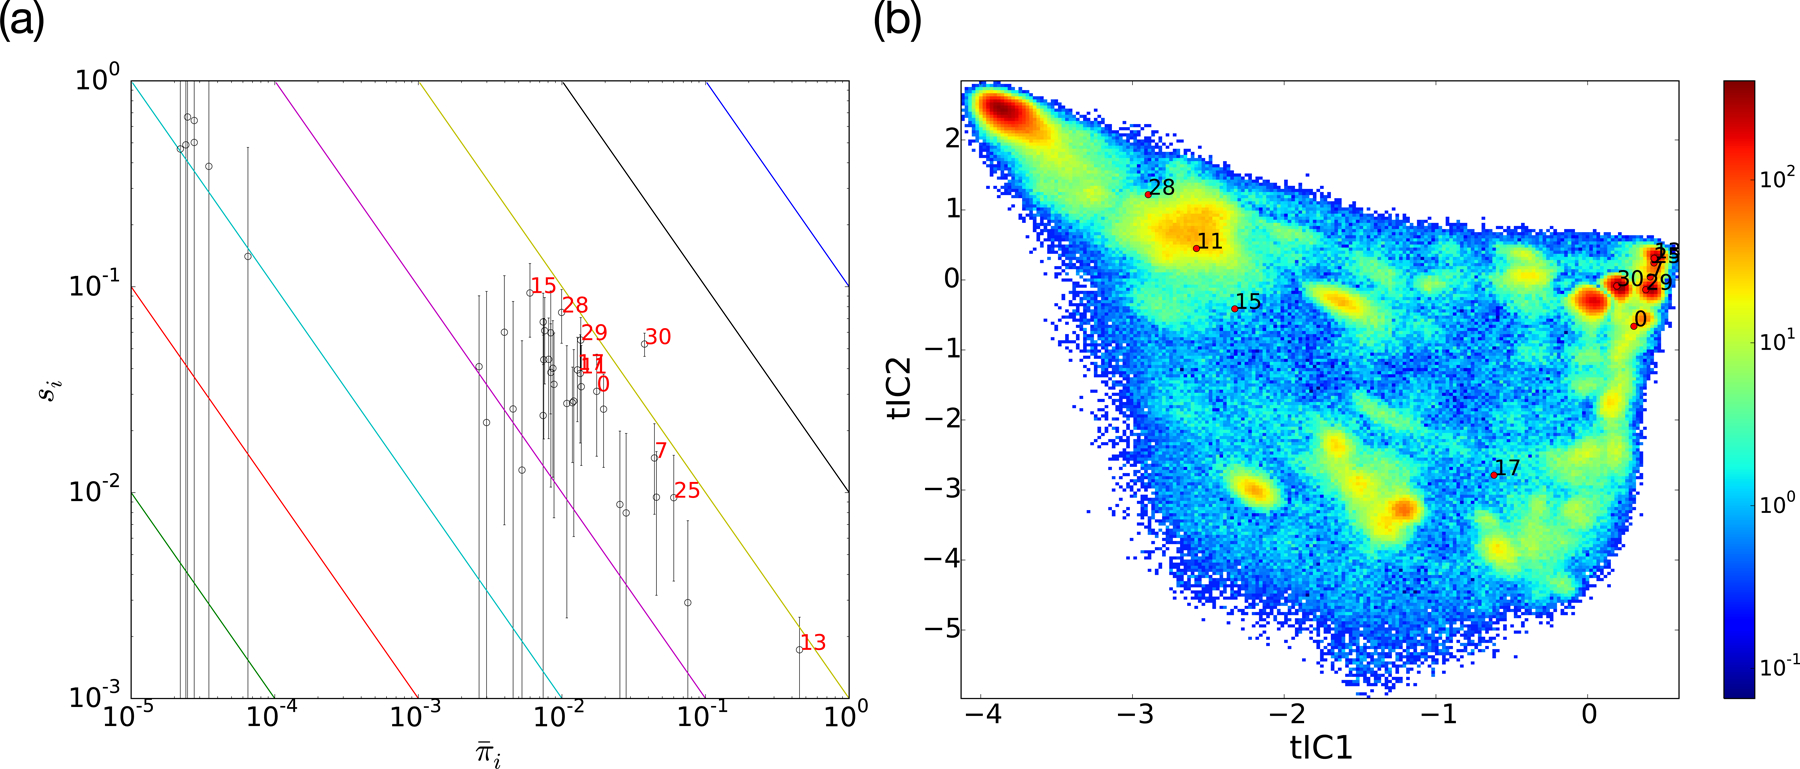
Figure 5:

Multi-model surprisal analysis for the eight Fs peptide sequences. (a) A (log-scale) scatter plot of si versus values for each macrostate. Error bars denote estimated uncertainties in si due to finite sampling. Diagonal lines correspond to contours where the JS value is constant, with red index labels marking the ten macrostates with the largest contributions to the JS. (b) The location of these macrostates on the JSpops tICA landscape show that they tend to lie between macrostates whose equilibrium populations are sensitively perturbed by sequence mutations.
