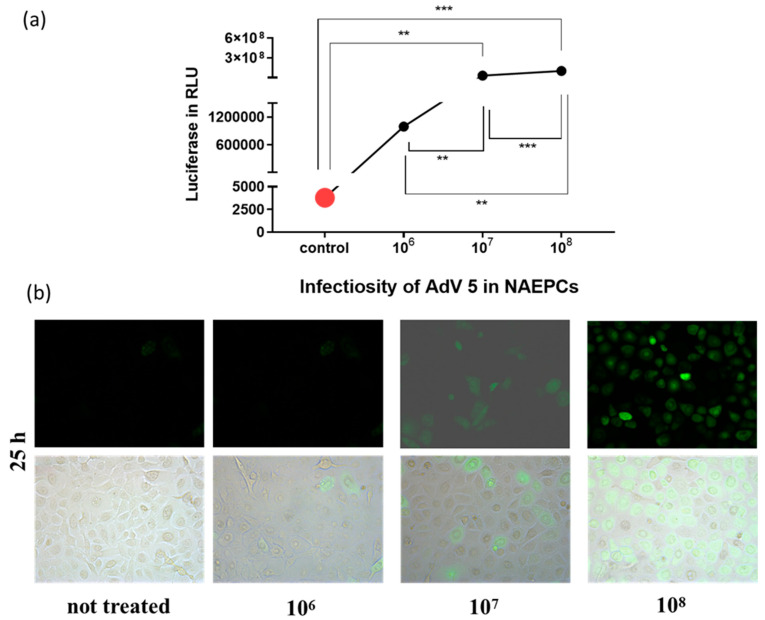
Figure 4.
Evaluation of AdV5 infection in NAEPCs. The cells obtained from healthy controls were infected using different virus concentrations (1 × 10⁶, 1 × 10⁷, and 1 × 10⁸ vpc). Twenty-five hours post-transduction, NAEPCs were analyzed through luciferase assay and immunofluorescence microscopy. As presented in (a), the higher the AdV5 concentration, the higher the transduction efficiency in NAEPCs. (b) These results were confirmed by immunofluorescence microscopic analyses (10× magnification) (n = 3).

