Figure 1.
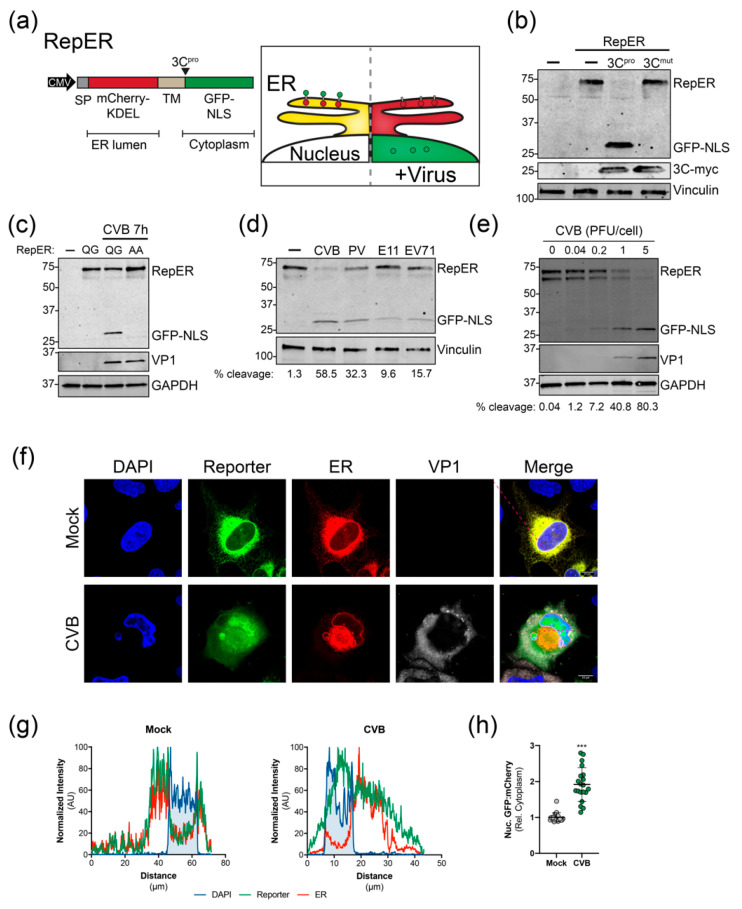
Validation of enterovirus plasmid-based reporters. (a) Left, RepER cassette driven by the CMV promoter. The RepER cassette contains an ER-localized mCherry containing a signal peptide (SP) and KDEL ER retention sequence followed by signal peptidase site fused to a transmembrane domain (TM) followed by the viral 3C protease (3Cpro) recognition sequence and GFP fused to a nuclear localization sequence (NLS). Right, Schematic of the predicted model for visualizing the ER and enterovirus infection. In uninfected cells (left) mCherry and GFP colocalize in the ER. During enterovirus infection (right,) viral 3Cpro cleavage releases the GFP-NLS, which translocates to the nucleus. (b) Immunoblot of GFP, myc, and vinculin from lysates from U2OS cells transfected with RepER and empty (-), CVB 3Cpro-myc, or catalytically inactive CVB 3Cpro-myc (3Cmut) expression plasmids. (c) Immunoblot for GFP, VP1, and GAPDH from lysates from CVB infected (100 PFU/cell) U2OS cells transfected with RepER or RepER containing an AA mutation to the QG in the 3Cpro recognition sequence. The presence of a weak lower RepER band indicates poor host signal peptidase-dependent release of mCherry-KDEL from the TM anchor. (d) Immoblot of GFP and vinculin from lysates from HeLa cells transfected with RepER followed by infection (1 PFU/cell) with CVB, poliovirus (PV), echovirus 11 (E11), or enterovirus 71 (EV71) for 7 h. Quantification of percent cleavge is shown below. (e) Immoblot for GFP, VP1, and GAPDH of HeLa cells expressing RepER infected with CVB at the indicated PFU/cell for 7 h. Quantification of percent cleavge is shown below. (f) Representative confocal images of mock and CVB infected U2OS cells expressing RepER stained for DAPI (blue) and CVB VP1 (gray), scale bars are 10 μm. (g) Normalized signal intensities of DAPI, GFP (reporter), and mCherry (ER) from line plot analyses of confocal images shown in (f), which show higher GFP signal in the DAPI region upon CVB infection. (h) Quantification of the nuclear fluorescence intensity ratio of GFP to mCherry relative to the cytoplasmic fluorescence intensity of an internal standard for each cell (n = 20). Significance was determined by Student’s t-test, *** p < 0.0001.

