Figure 2.
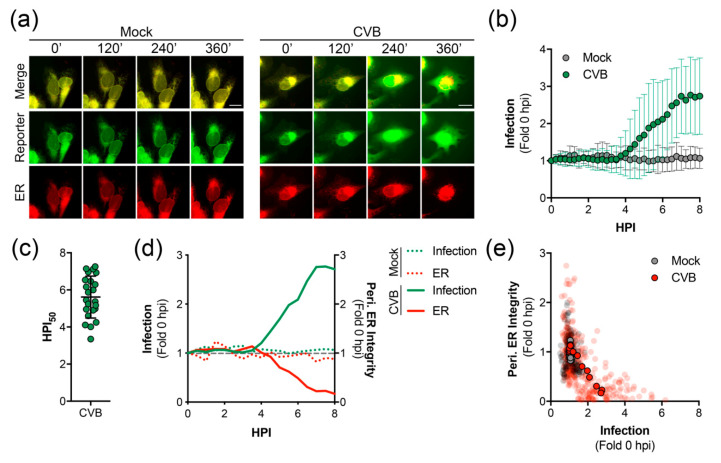
Time-lapse imaging of CVB infected cells expressing RepER. (a) Representative time-points of an image series from live-cell imaging of GFP (reporter, green), mCherry (ER, red), and merged panels from mock or CVB infected U2OS cells expressing RepER. Scale bars are 20 μm. (b) Quantification of infection in individual cells, defined as the ratio of nuclear to ER-dense microtubule-organizing center signal intensities, from individual RepER expressing cells either mock (n = 9) or CVB (n = 23) infected. Measurements were taken every 15 min, and data is shown as the average ± SD of the fold change in infection signal compared to 0 hpi. (c) Determination of the time point at which 50% maximum infection signal was observed (HPI50) as determined by nonlinear regression curve analysis for each CVB infected cell. Each data point shown is the HPI50 for an individual cell (n = 23), and the line represents the average ± SD. (d) Quantification of infection (green) and peripheral ER integrity (red) for the mock (dashed lines, n = 9) and CVB (solid lines, n = 23) infected cells shown as the average fold change compared to 0 hpi; the gray dashed line shows fold change of 1. (e) Scatter plot of infection and peripheral ER integrity. Transparent dots represent individual measurements taken every 15 min for individual mock (gray, n = 9) or CVB (red, n = 23) infected cells from 0 to 8 hpi; solid outlined dots represent the averages.

